Reports
The Reporting Module has several types of reports. There are generally 3 types of reports: Graphical, Summary, and Detailed. Additionally there might be more report types in each category. A few of the categories are as follows:

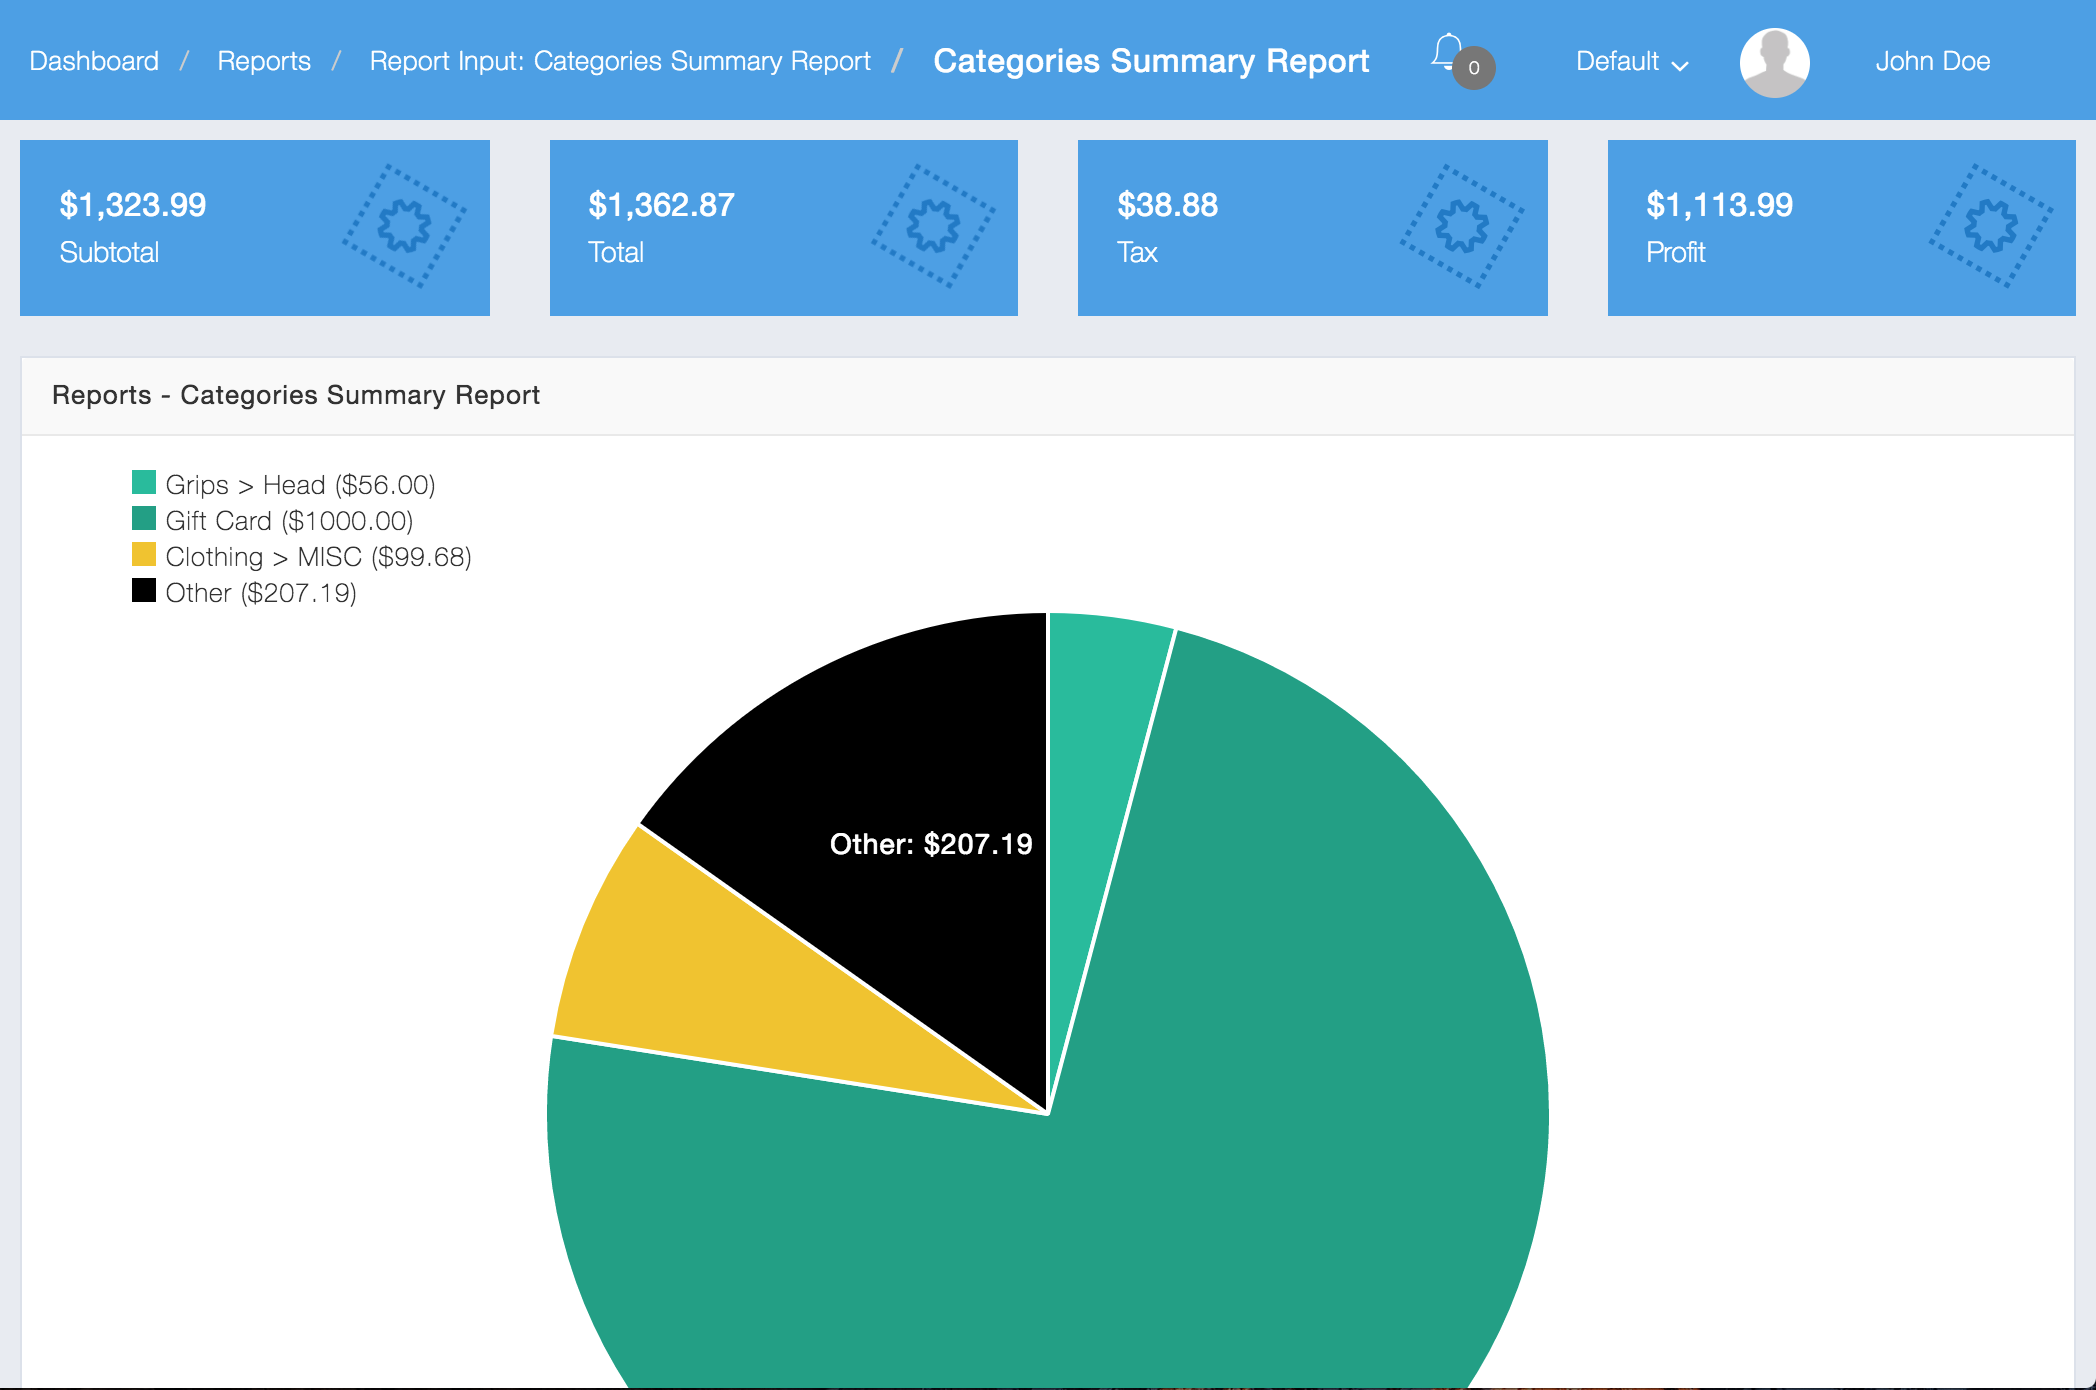
The Categories Graphical will show a pie chart for each category by total.
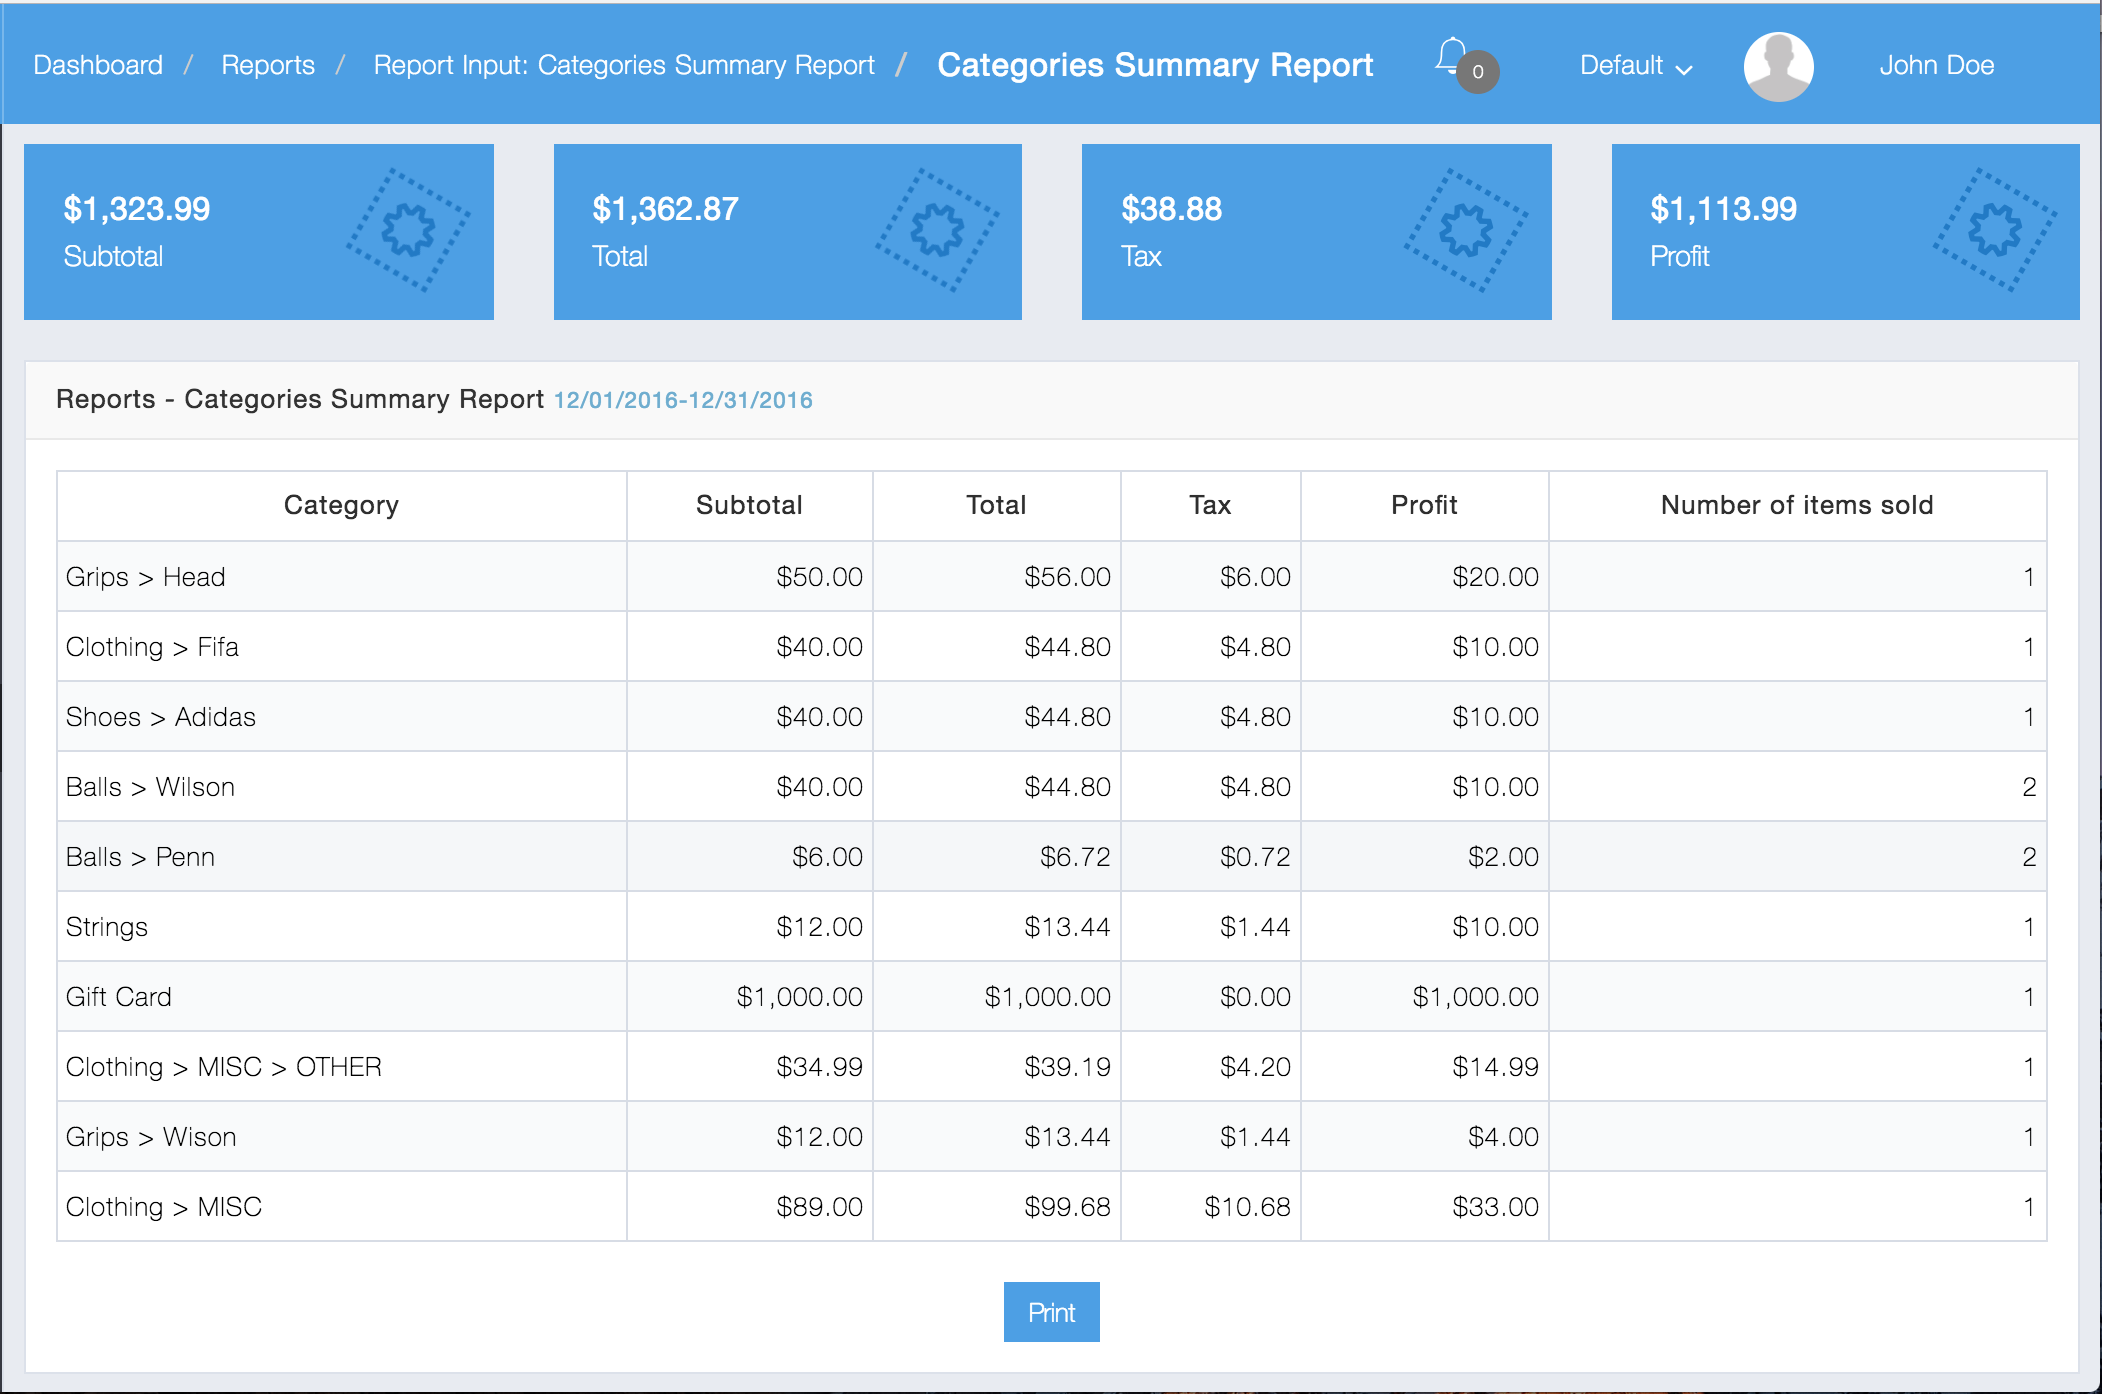
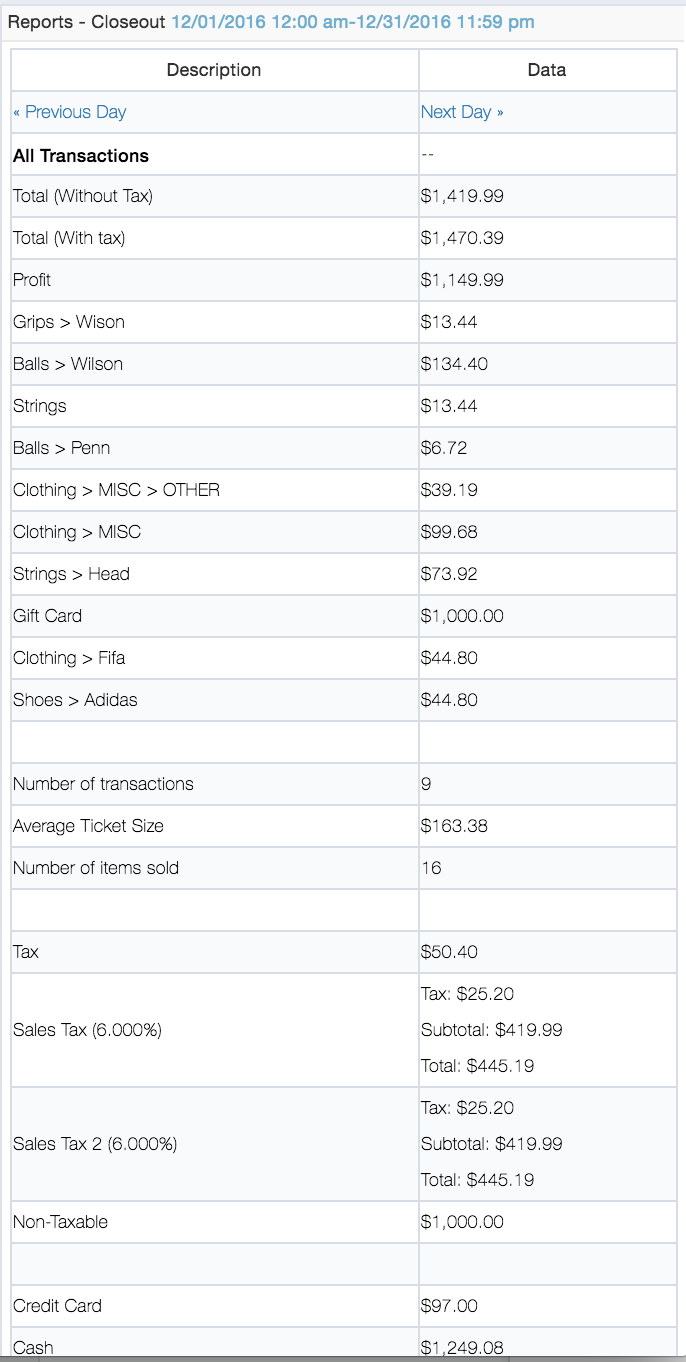
Closeout Summary Reports breaks down transactions for each day for All Transactions, Sales, Returns, Discounts, inventory, and Receivings
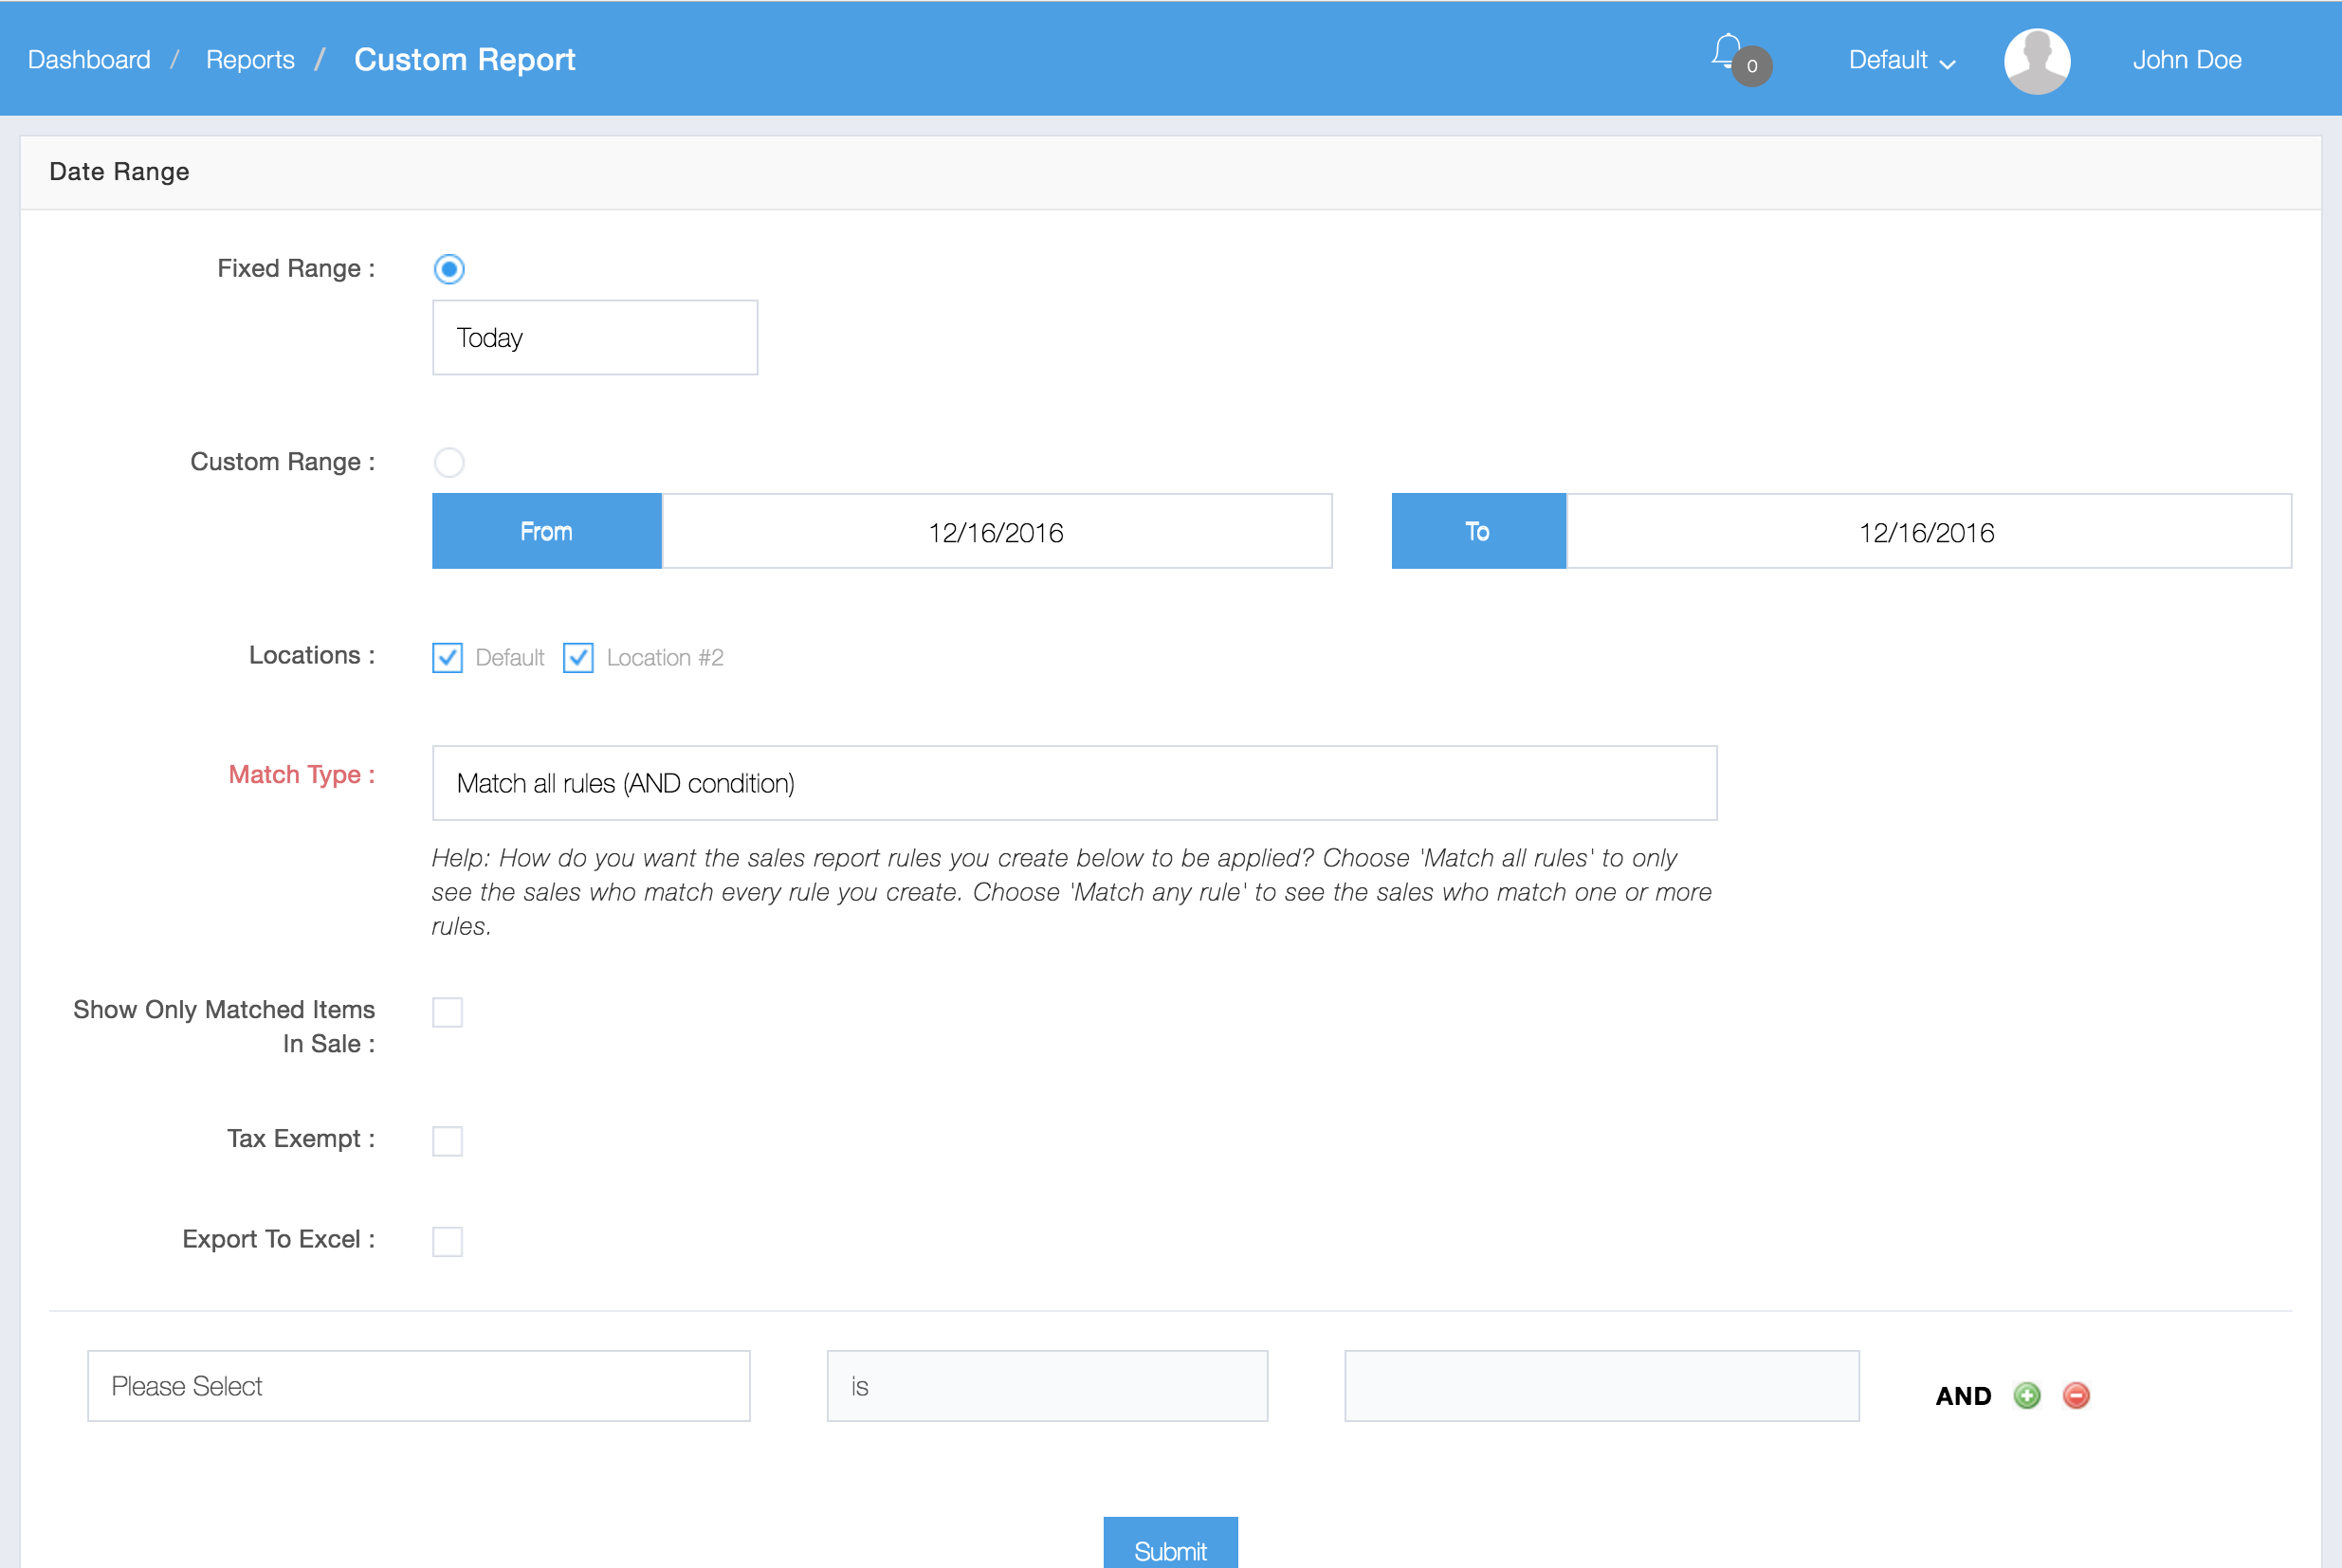
Custom Reports allows you lots of flexibility to create your own reports.
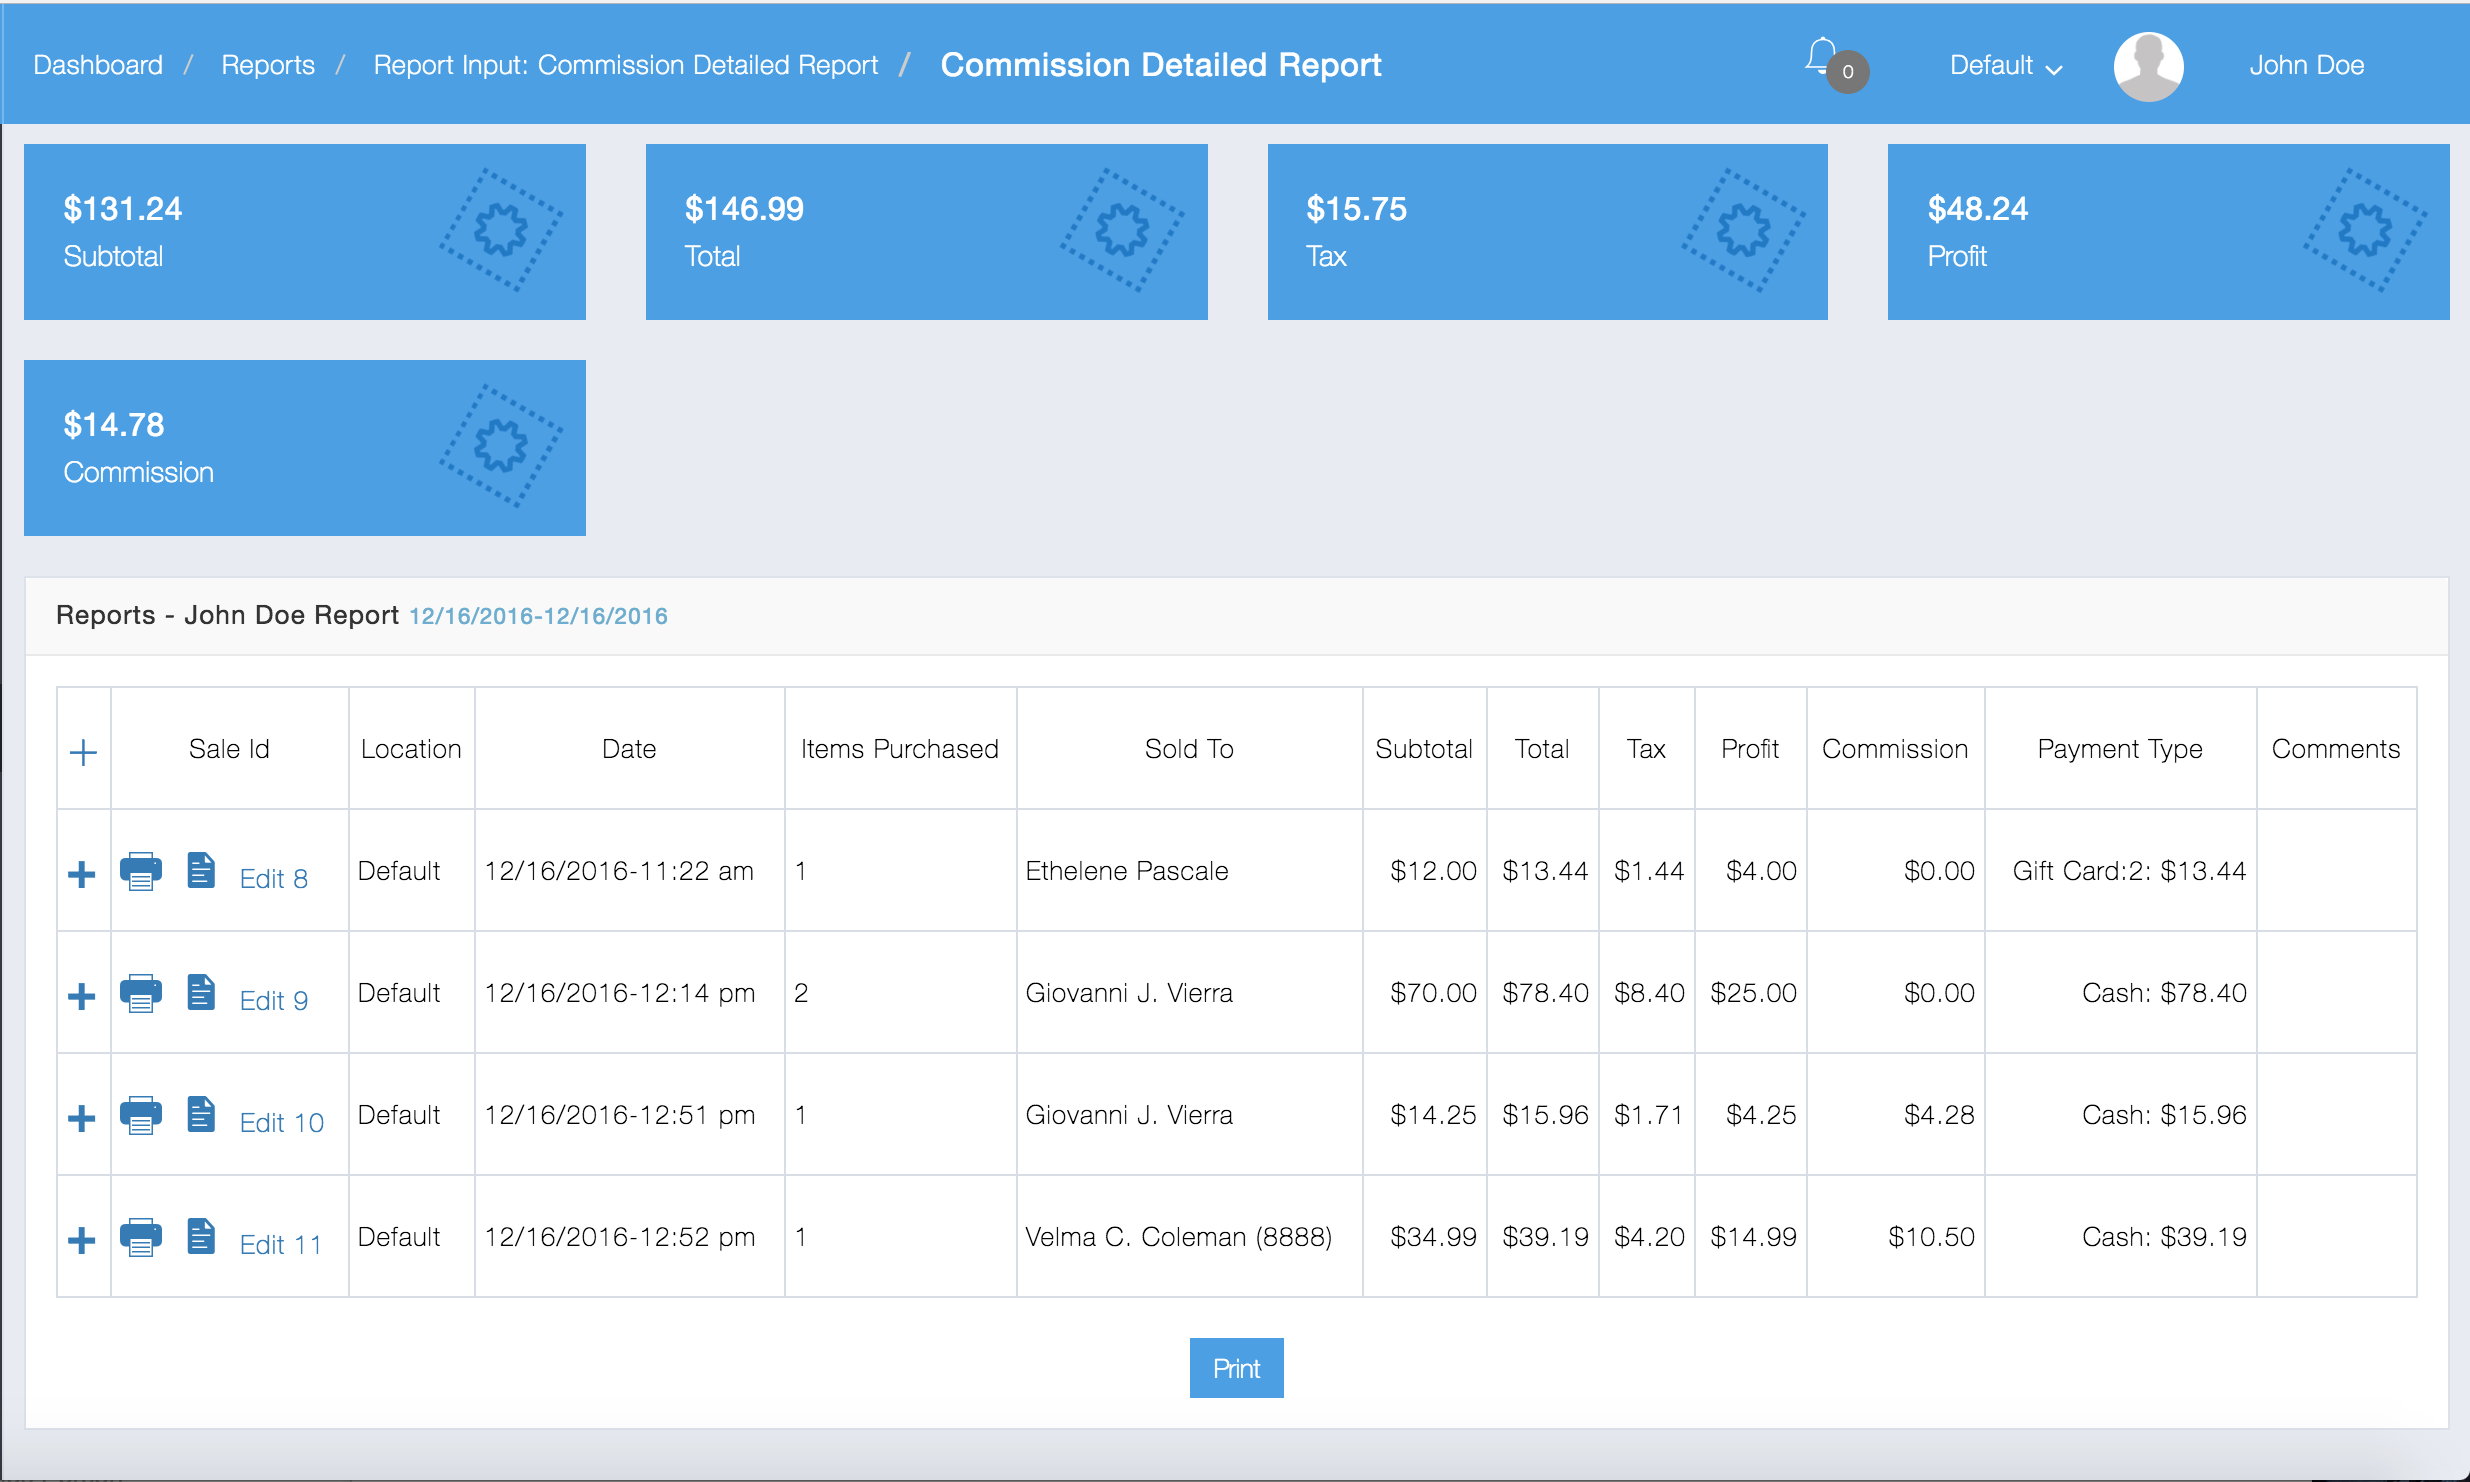
Commission Reports track the amount of money made on commission. Below is an example of a Detailed Commission Report:
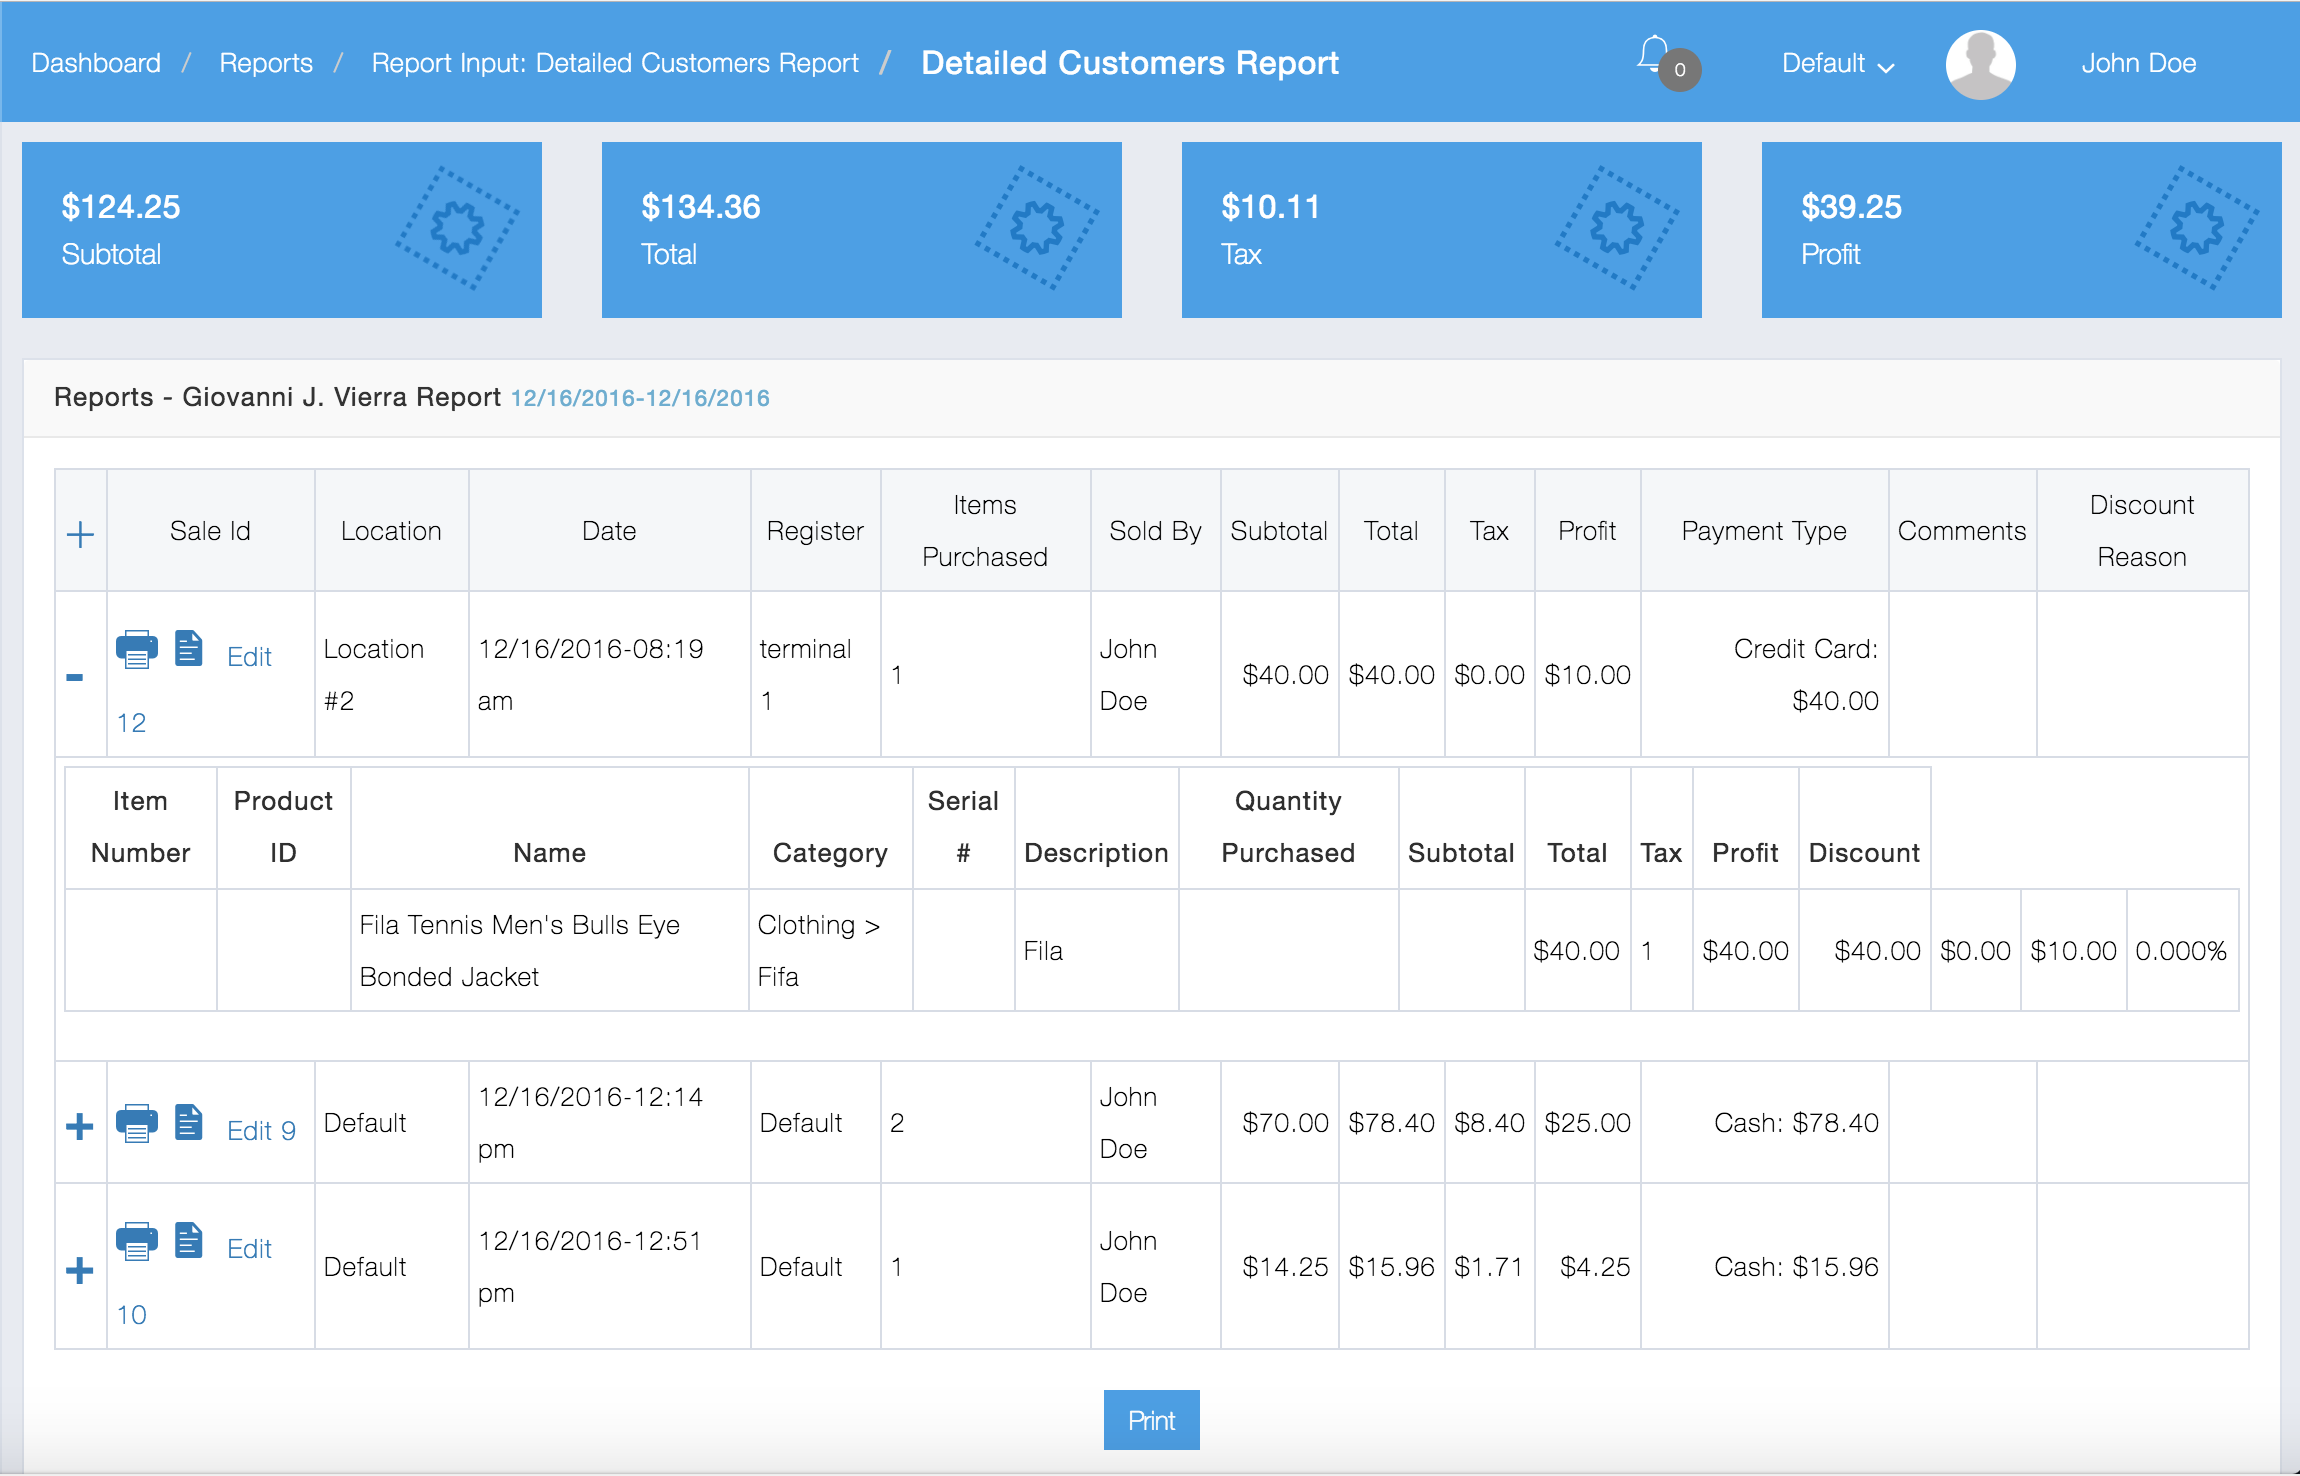
Customers reports give you a detailed insight into your sales and returns based on customers.
You can view up a Detailed Customers Report for a Specific Customer:
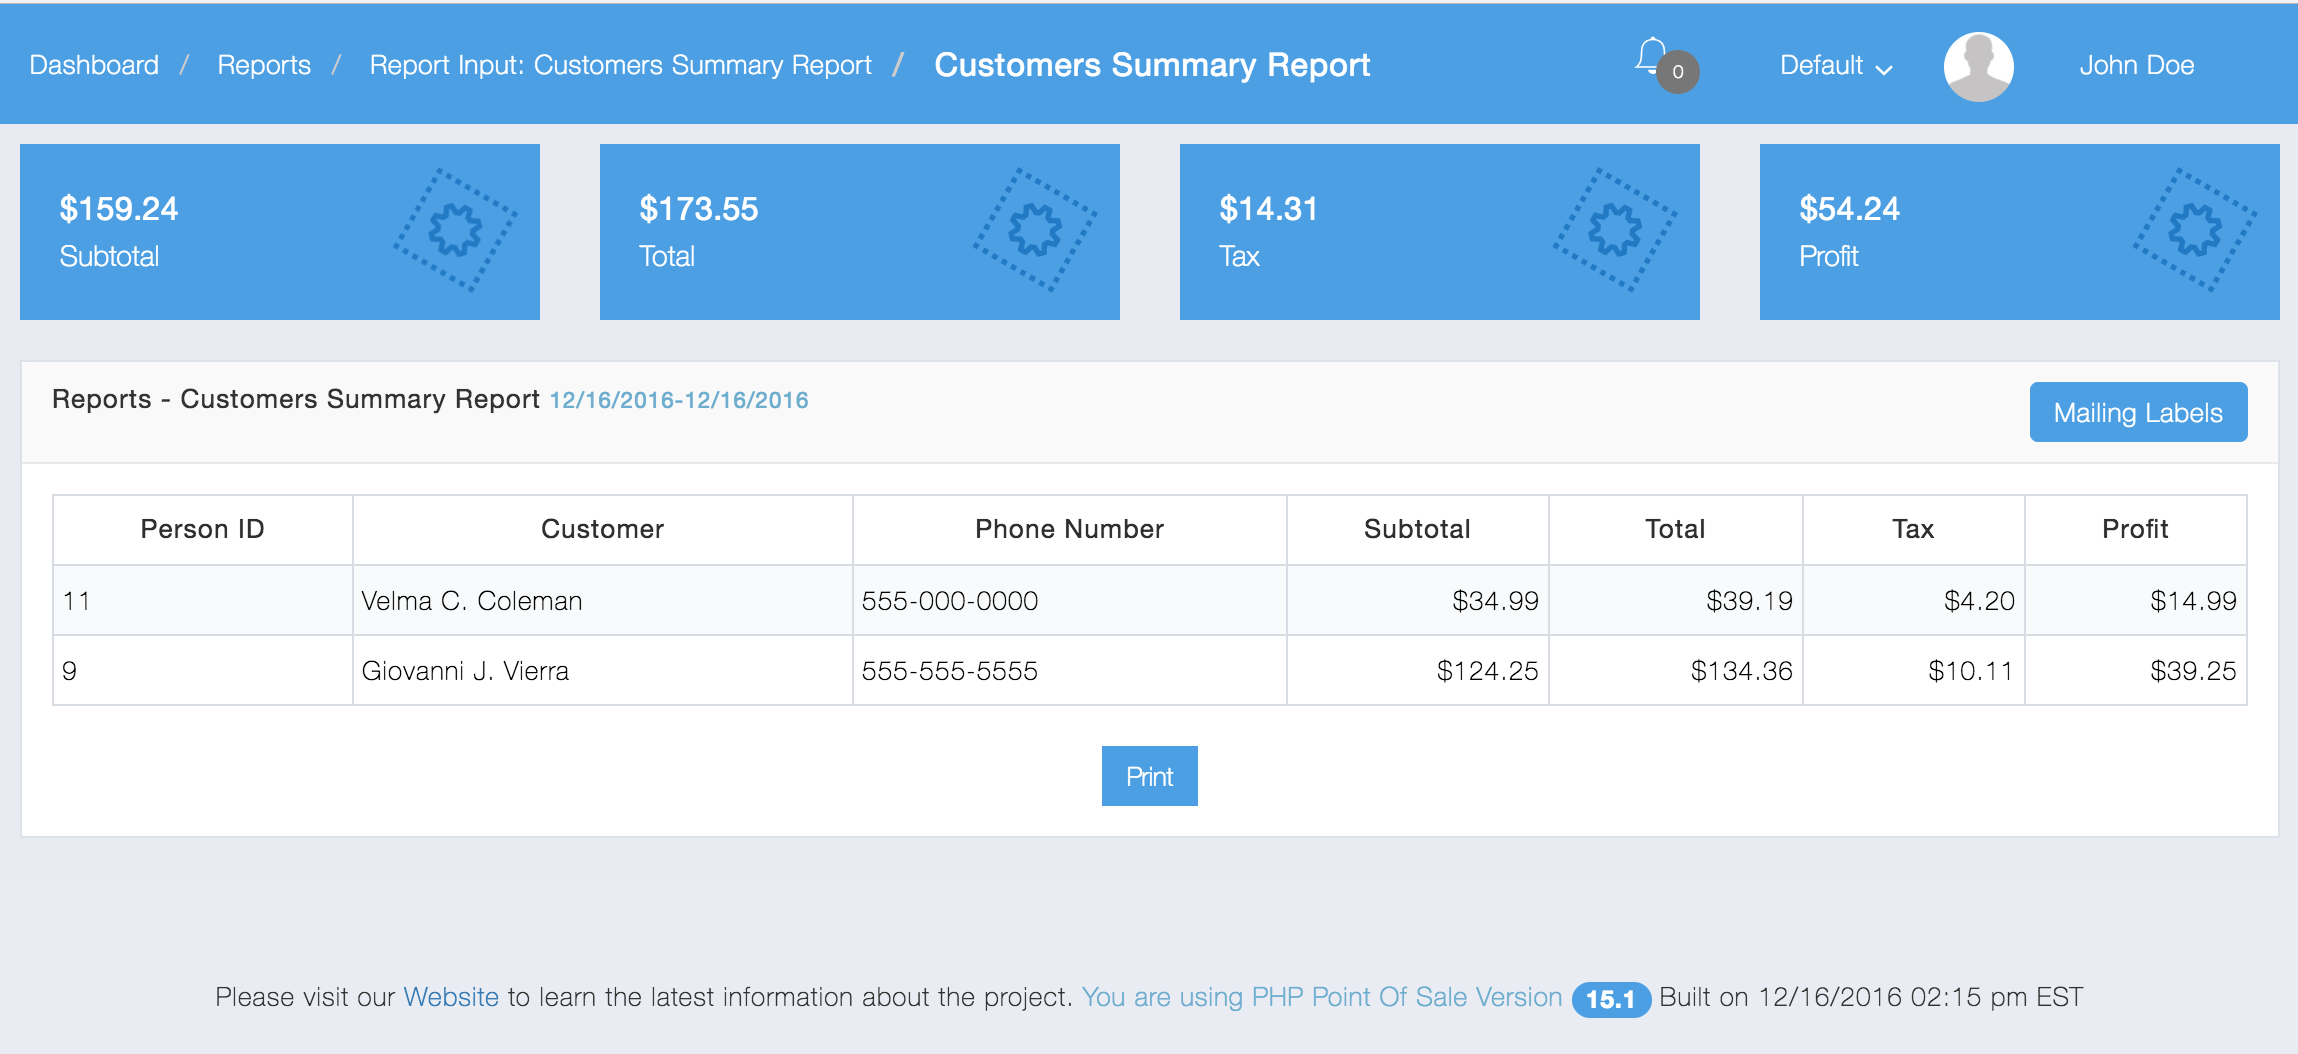
Below is a Customers Summary Report:
Below is a Graphical Customers Report:
These Deleted Sales reports allow you to keep track of sales that were deleted.
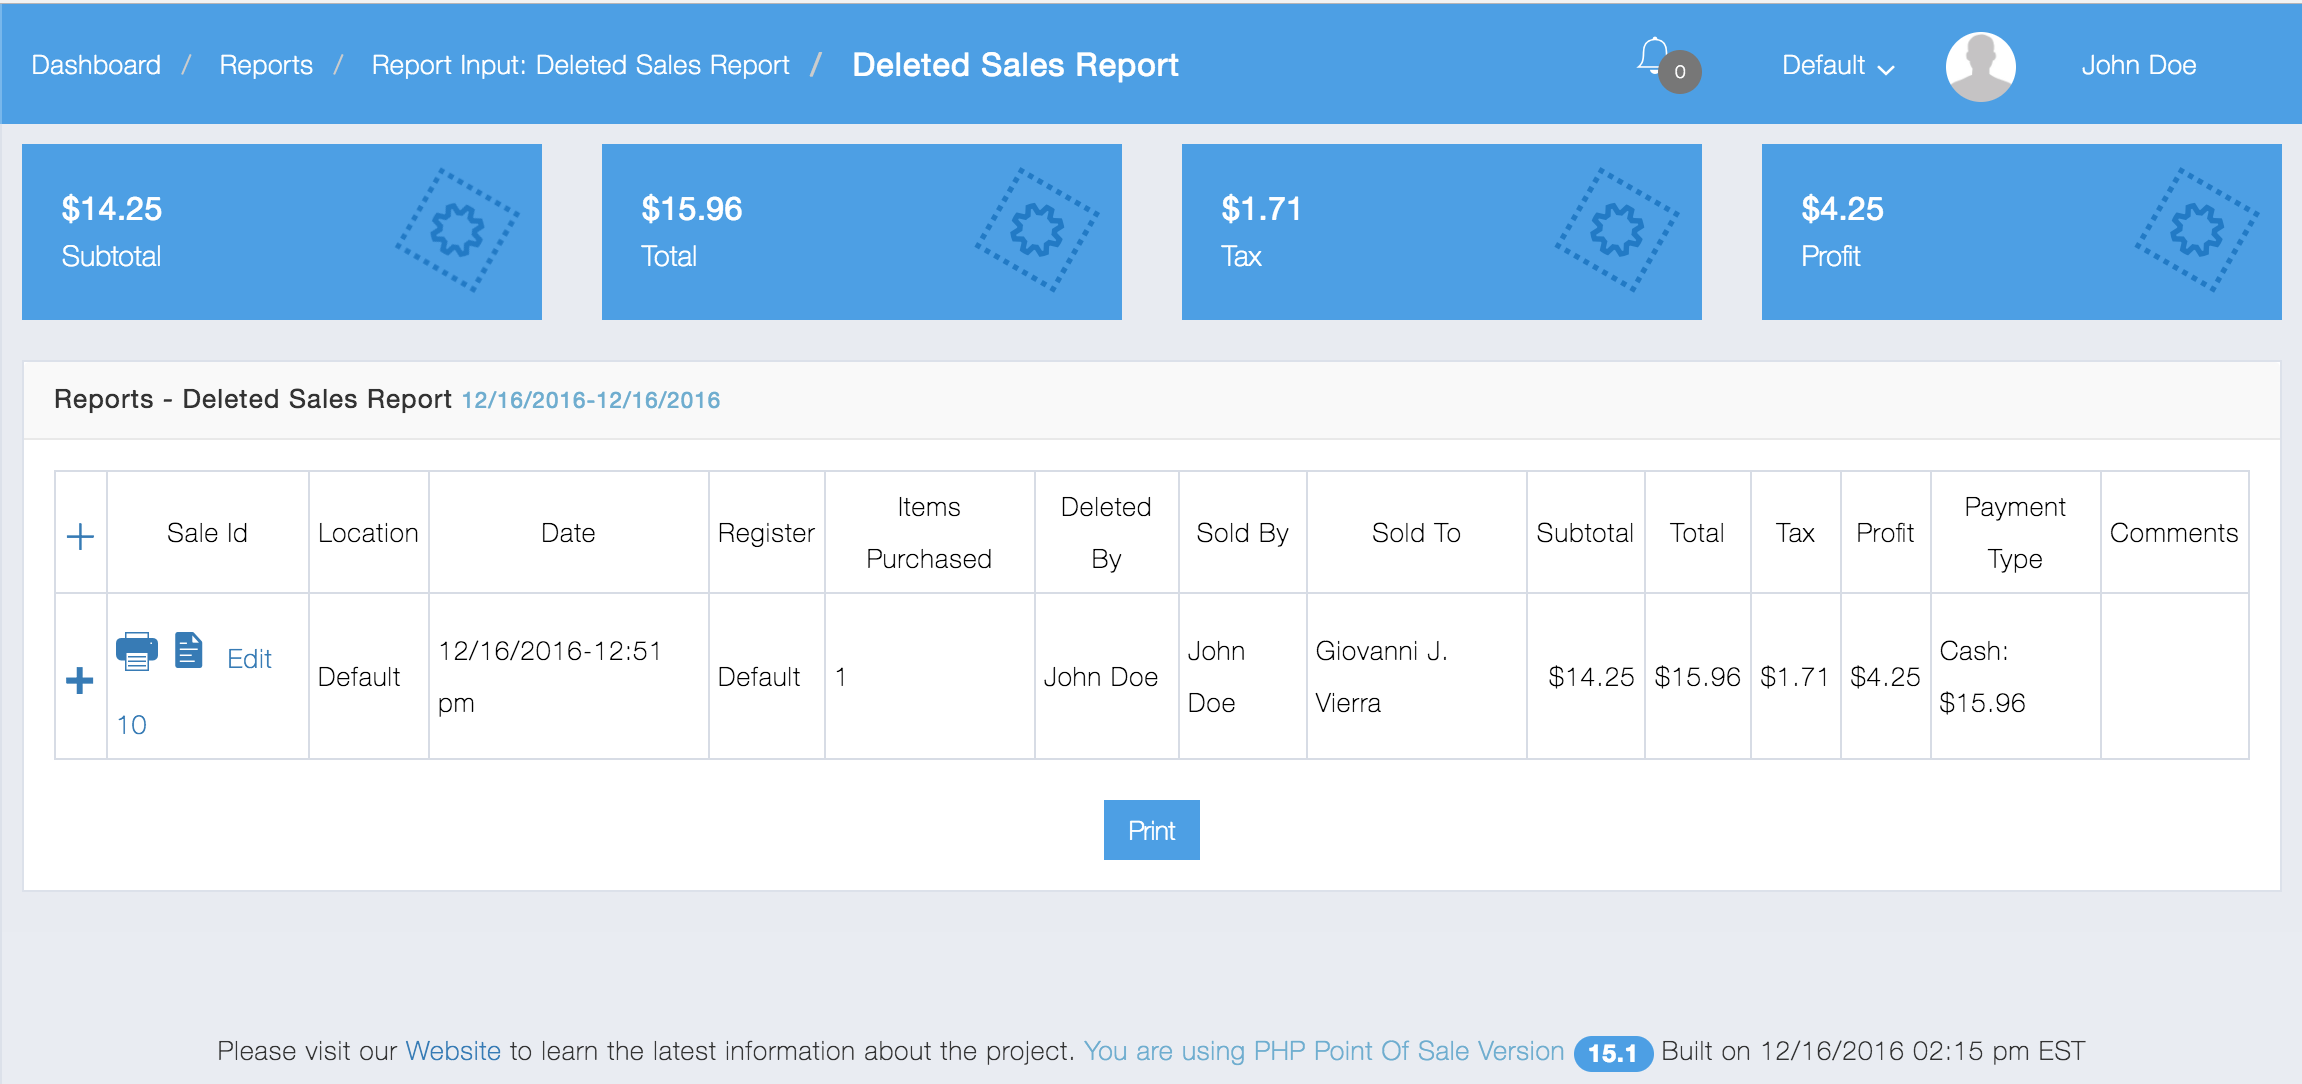
Deleted Sales
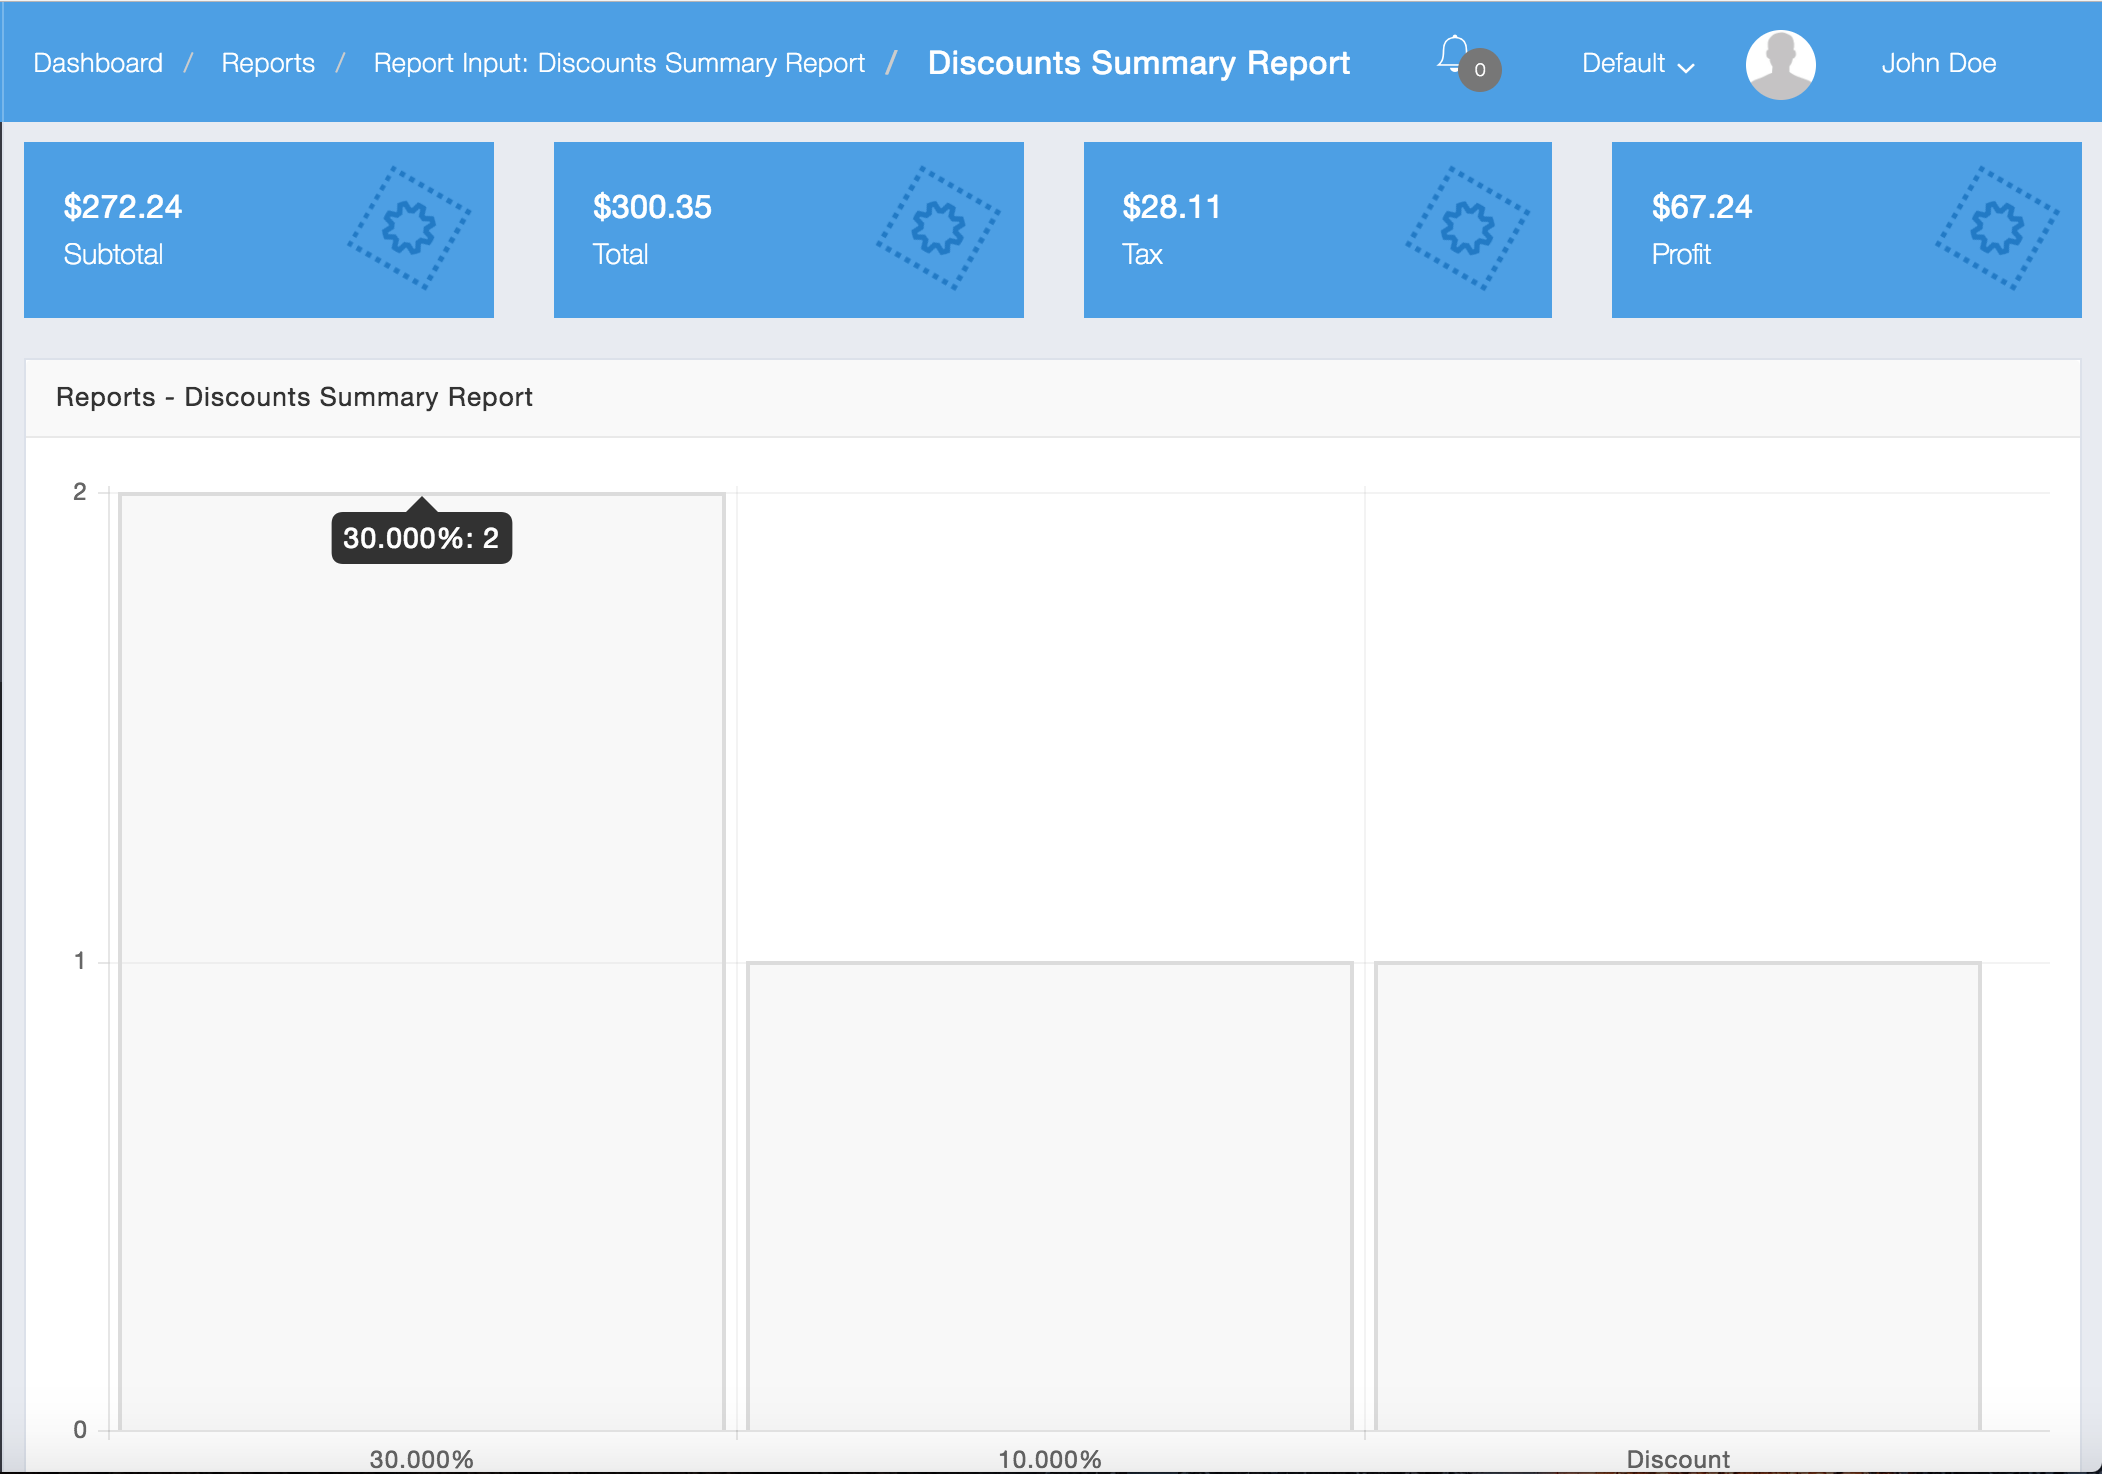
The discounts reports allow you to track discounts to sales.
The Graphical Discounts Report shows the number of items that were discounted in a sale with each corresponding percentage.
The “Discount” column is the number of sales where “Discount Entire Sale” was set, whereas the other rows are for itemized discounts across all sales.
Below is a Discount Graphical Report:
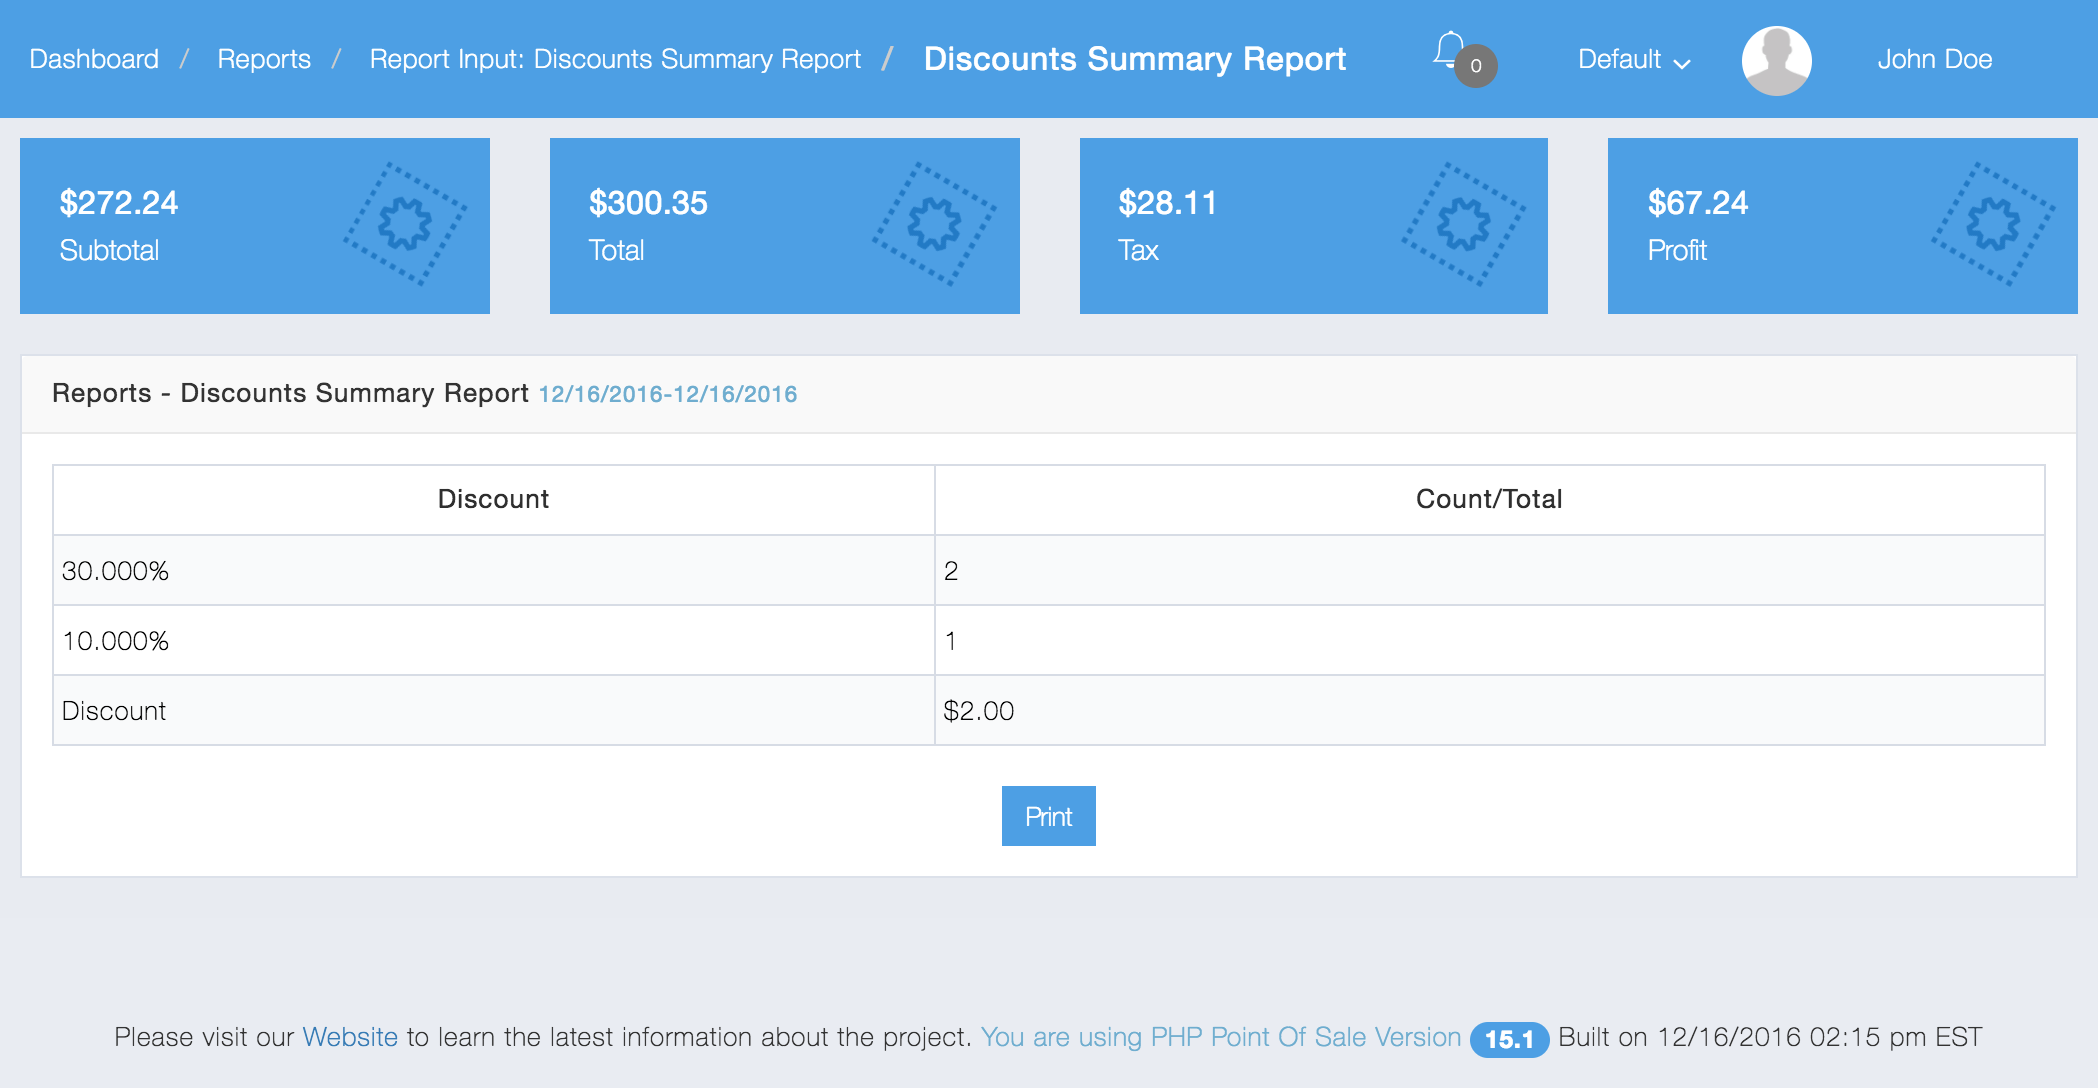
Below is a tabular Discount Summary Report:
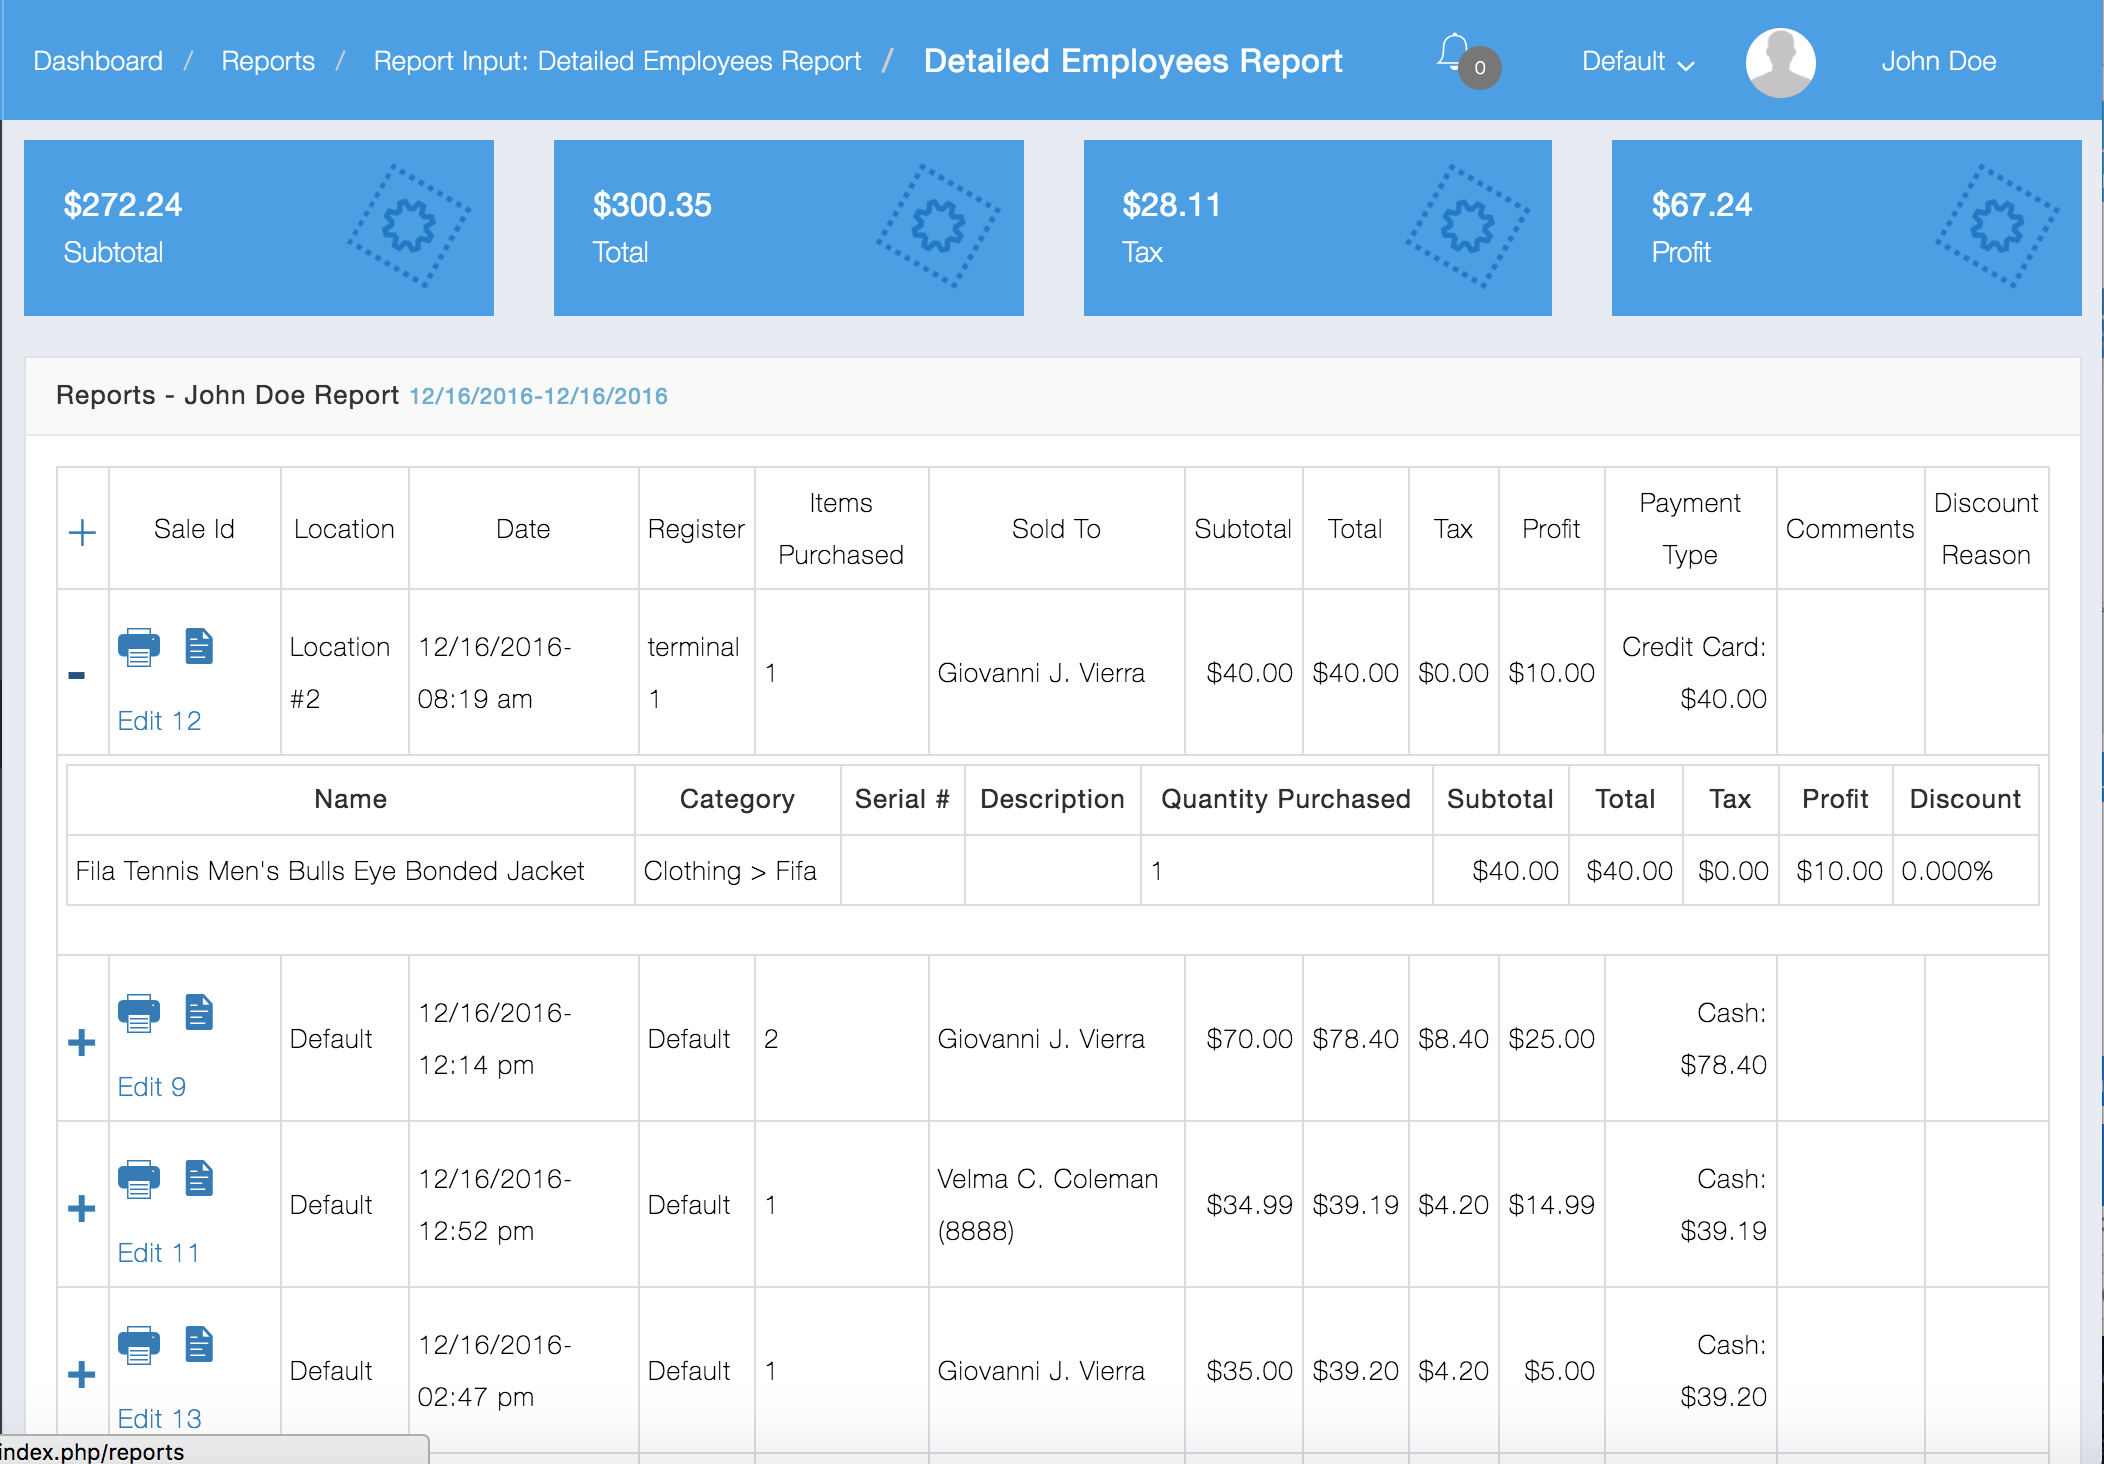
These reports allow you to see sales by employee. There are 3 basic report types for Employees: Graphical, Summary, and Detailed.
Below is an example of a Detailed Employees Report:
These reports show all information related to Expenses.
Below is an example of a Detailed Expense Report:
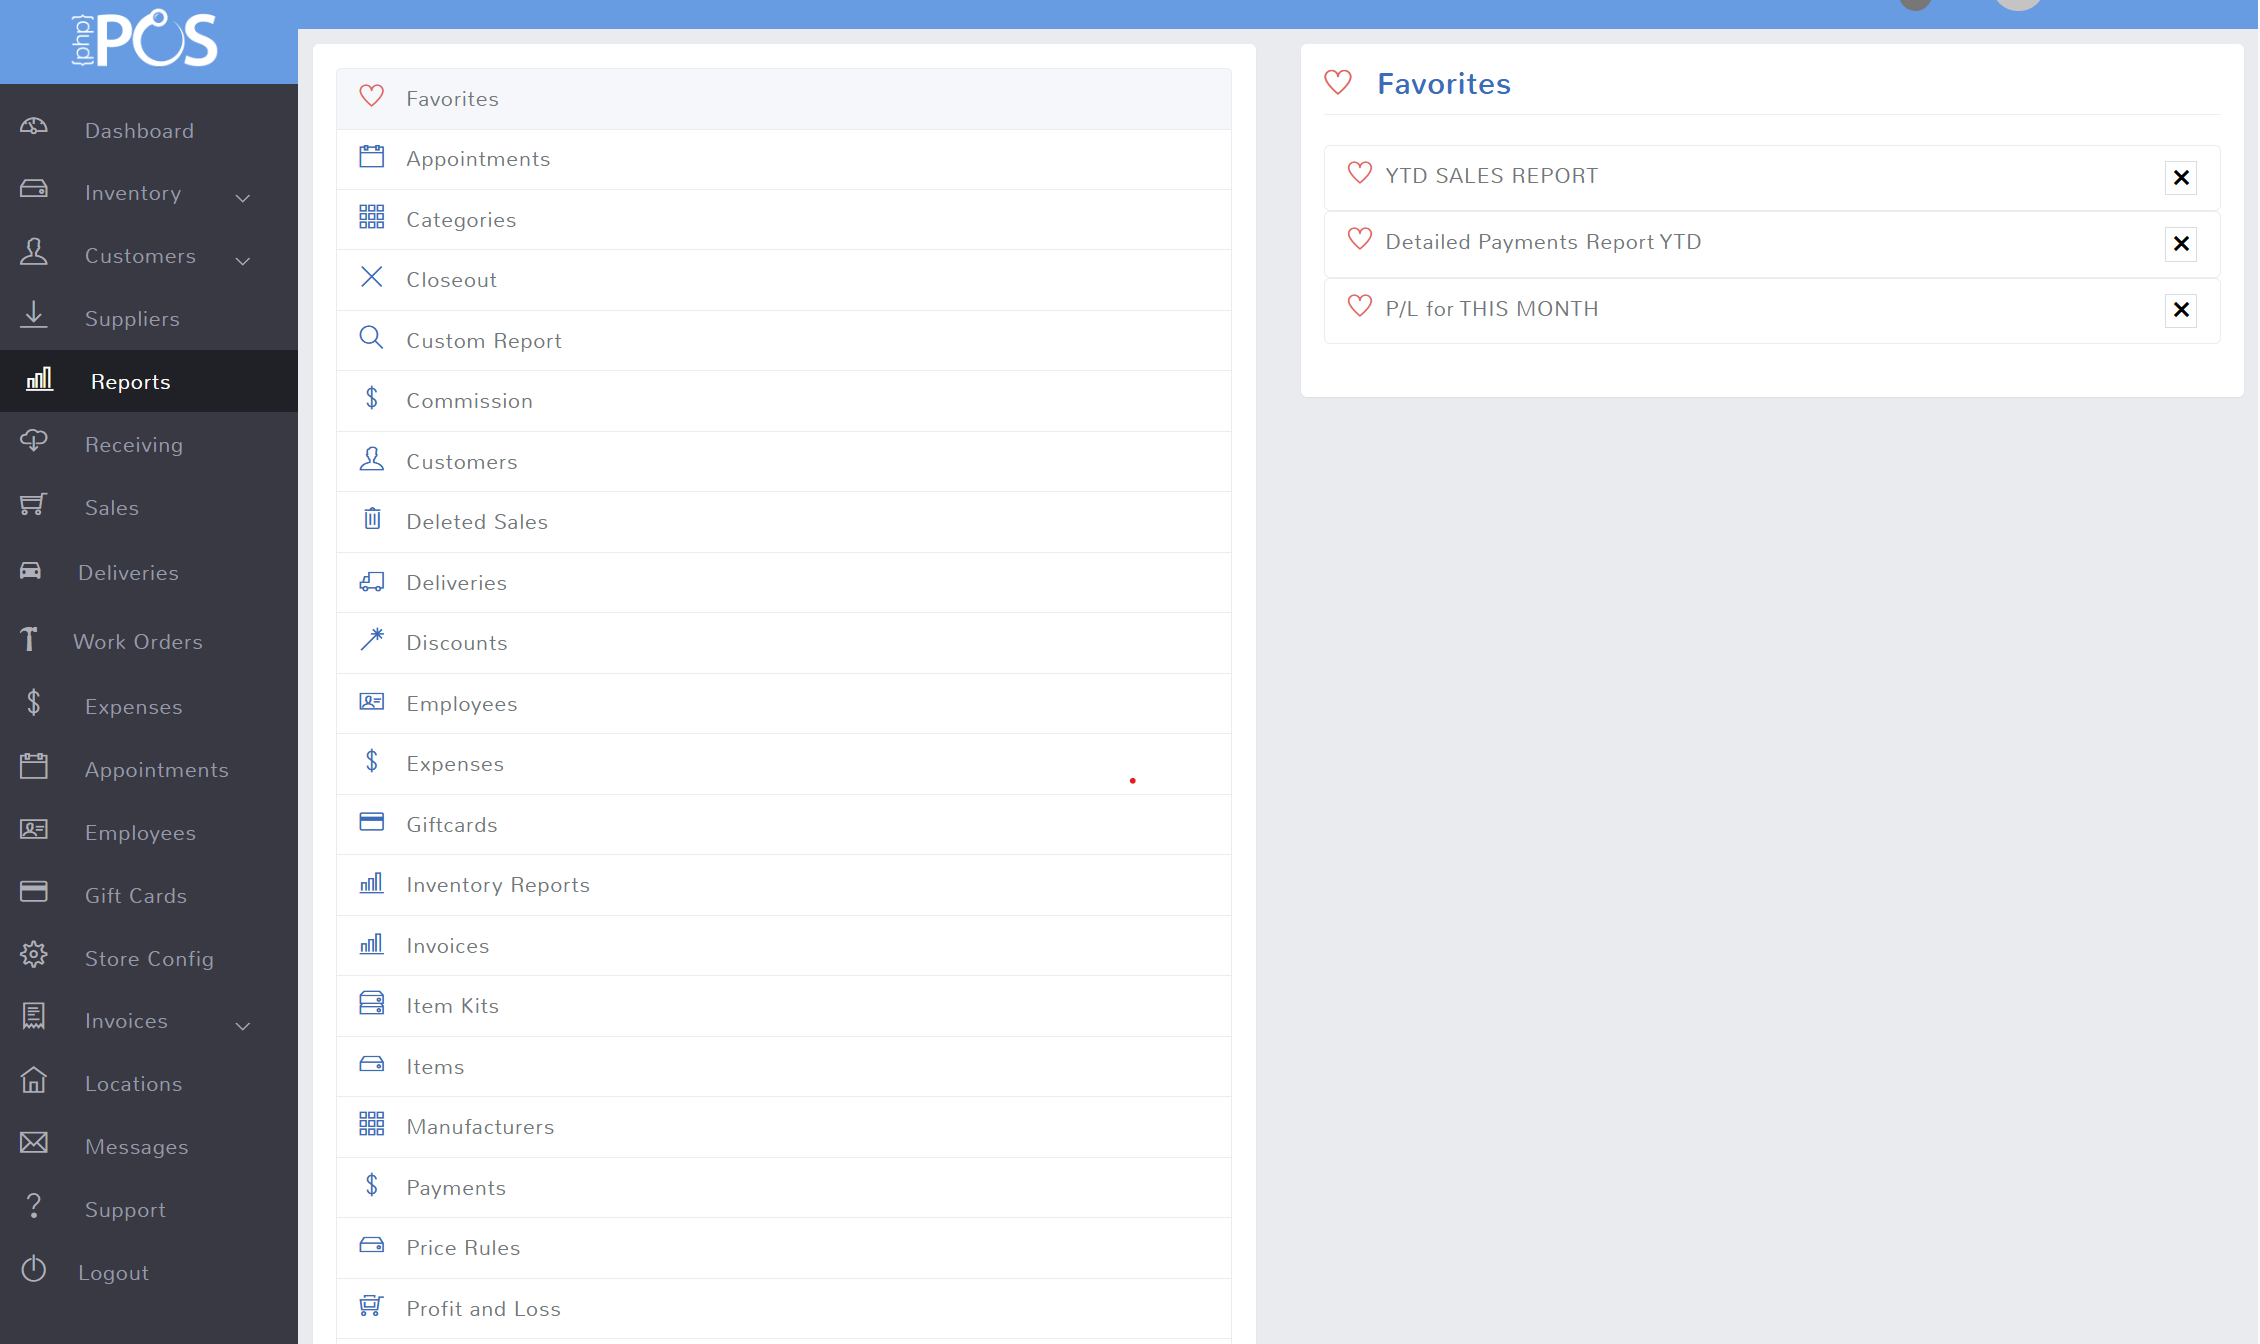
You can make shortcuts to get to your favorite reports quicky. Simply run a report, and then click the blue box that says “add to favorites.” Once you add a report to favorites it will show both in your section in the reports and also in the second section of dashboard statistics with a start next to it.
Favorites show here in favorites section:
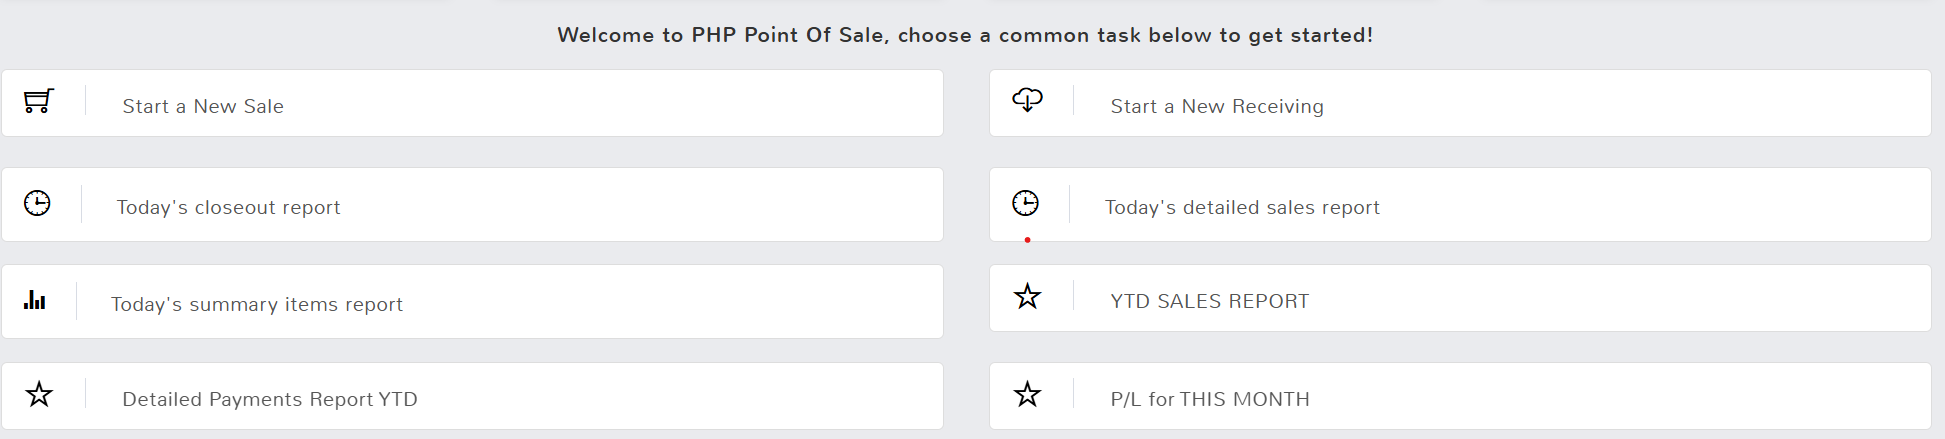
Favorites ALSO show here in the second section of dashboard statistics:
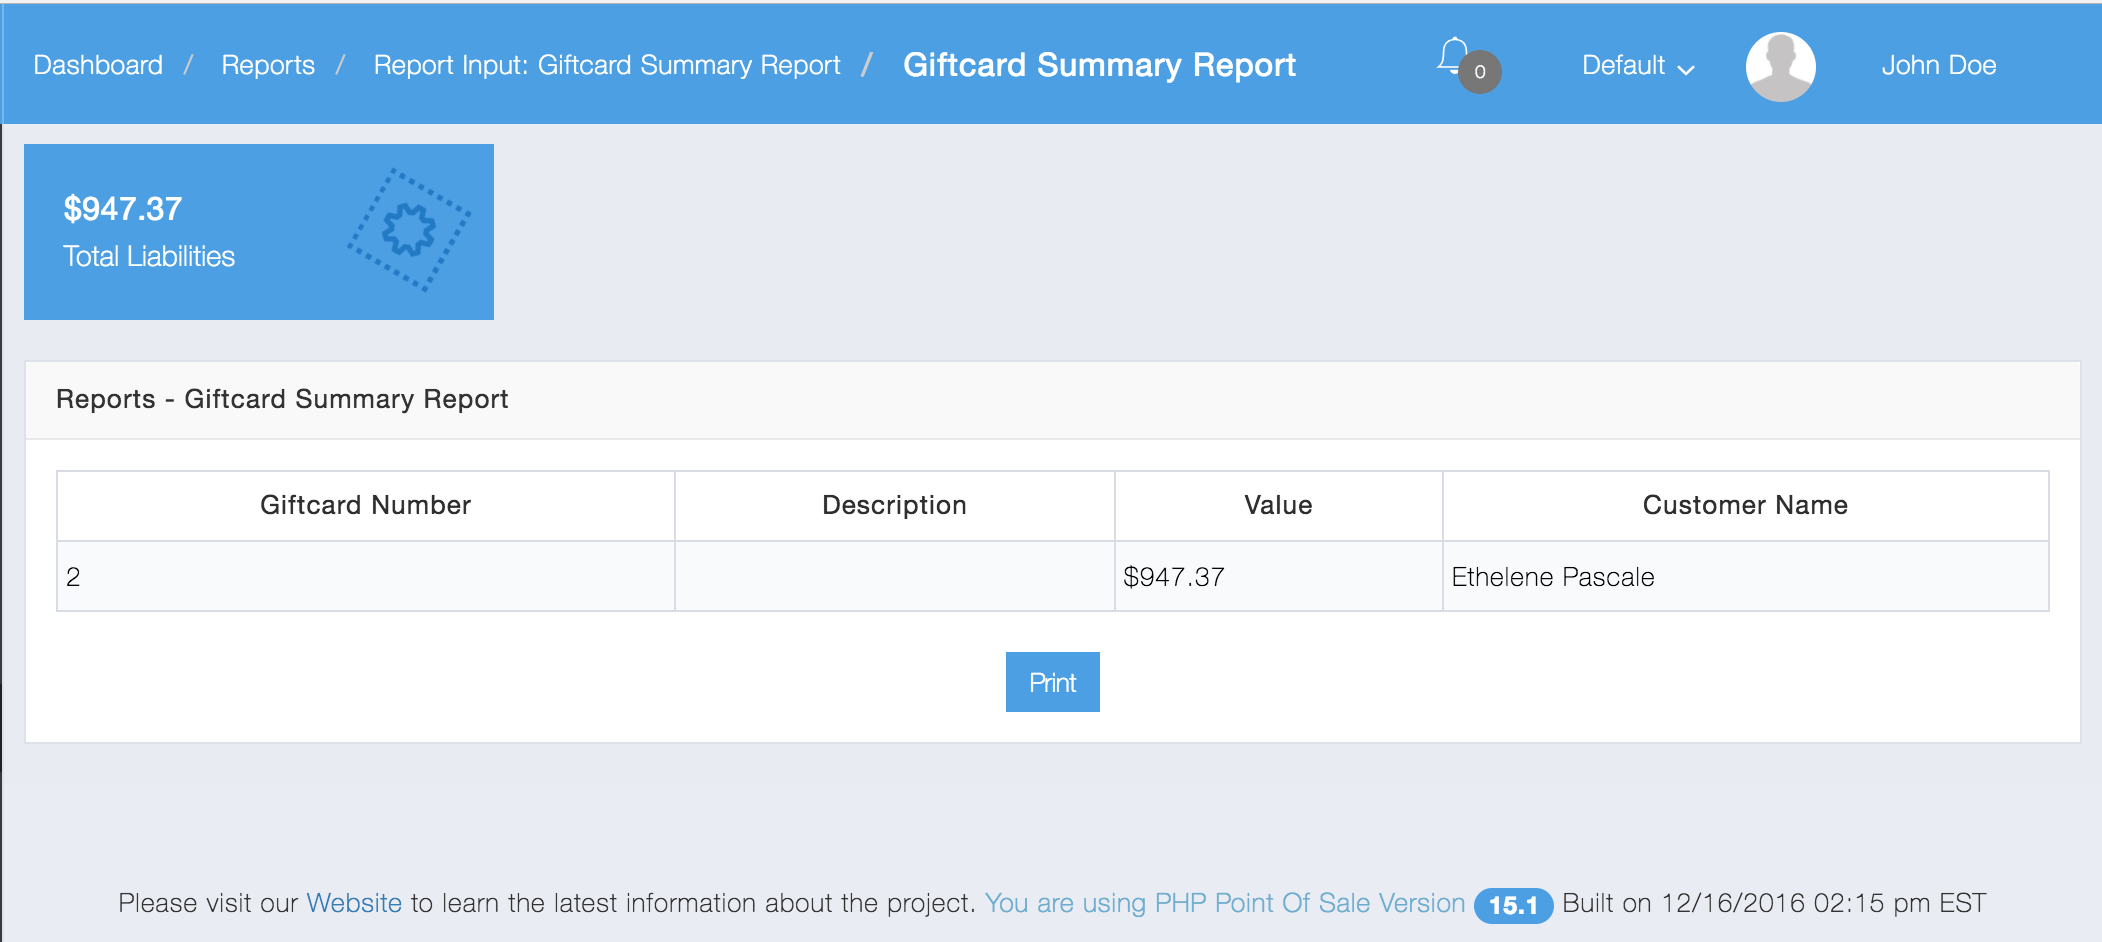
These reports allow you to audit or view all gift card information.
Below is an example of a Gift Card Summary Report
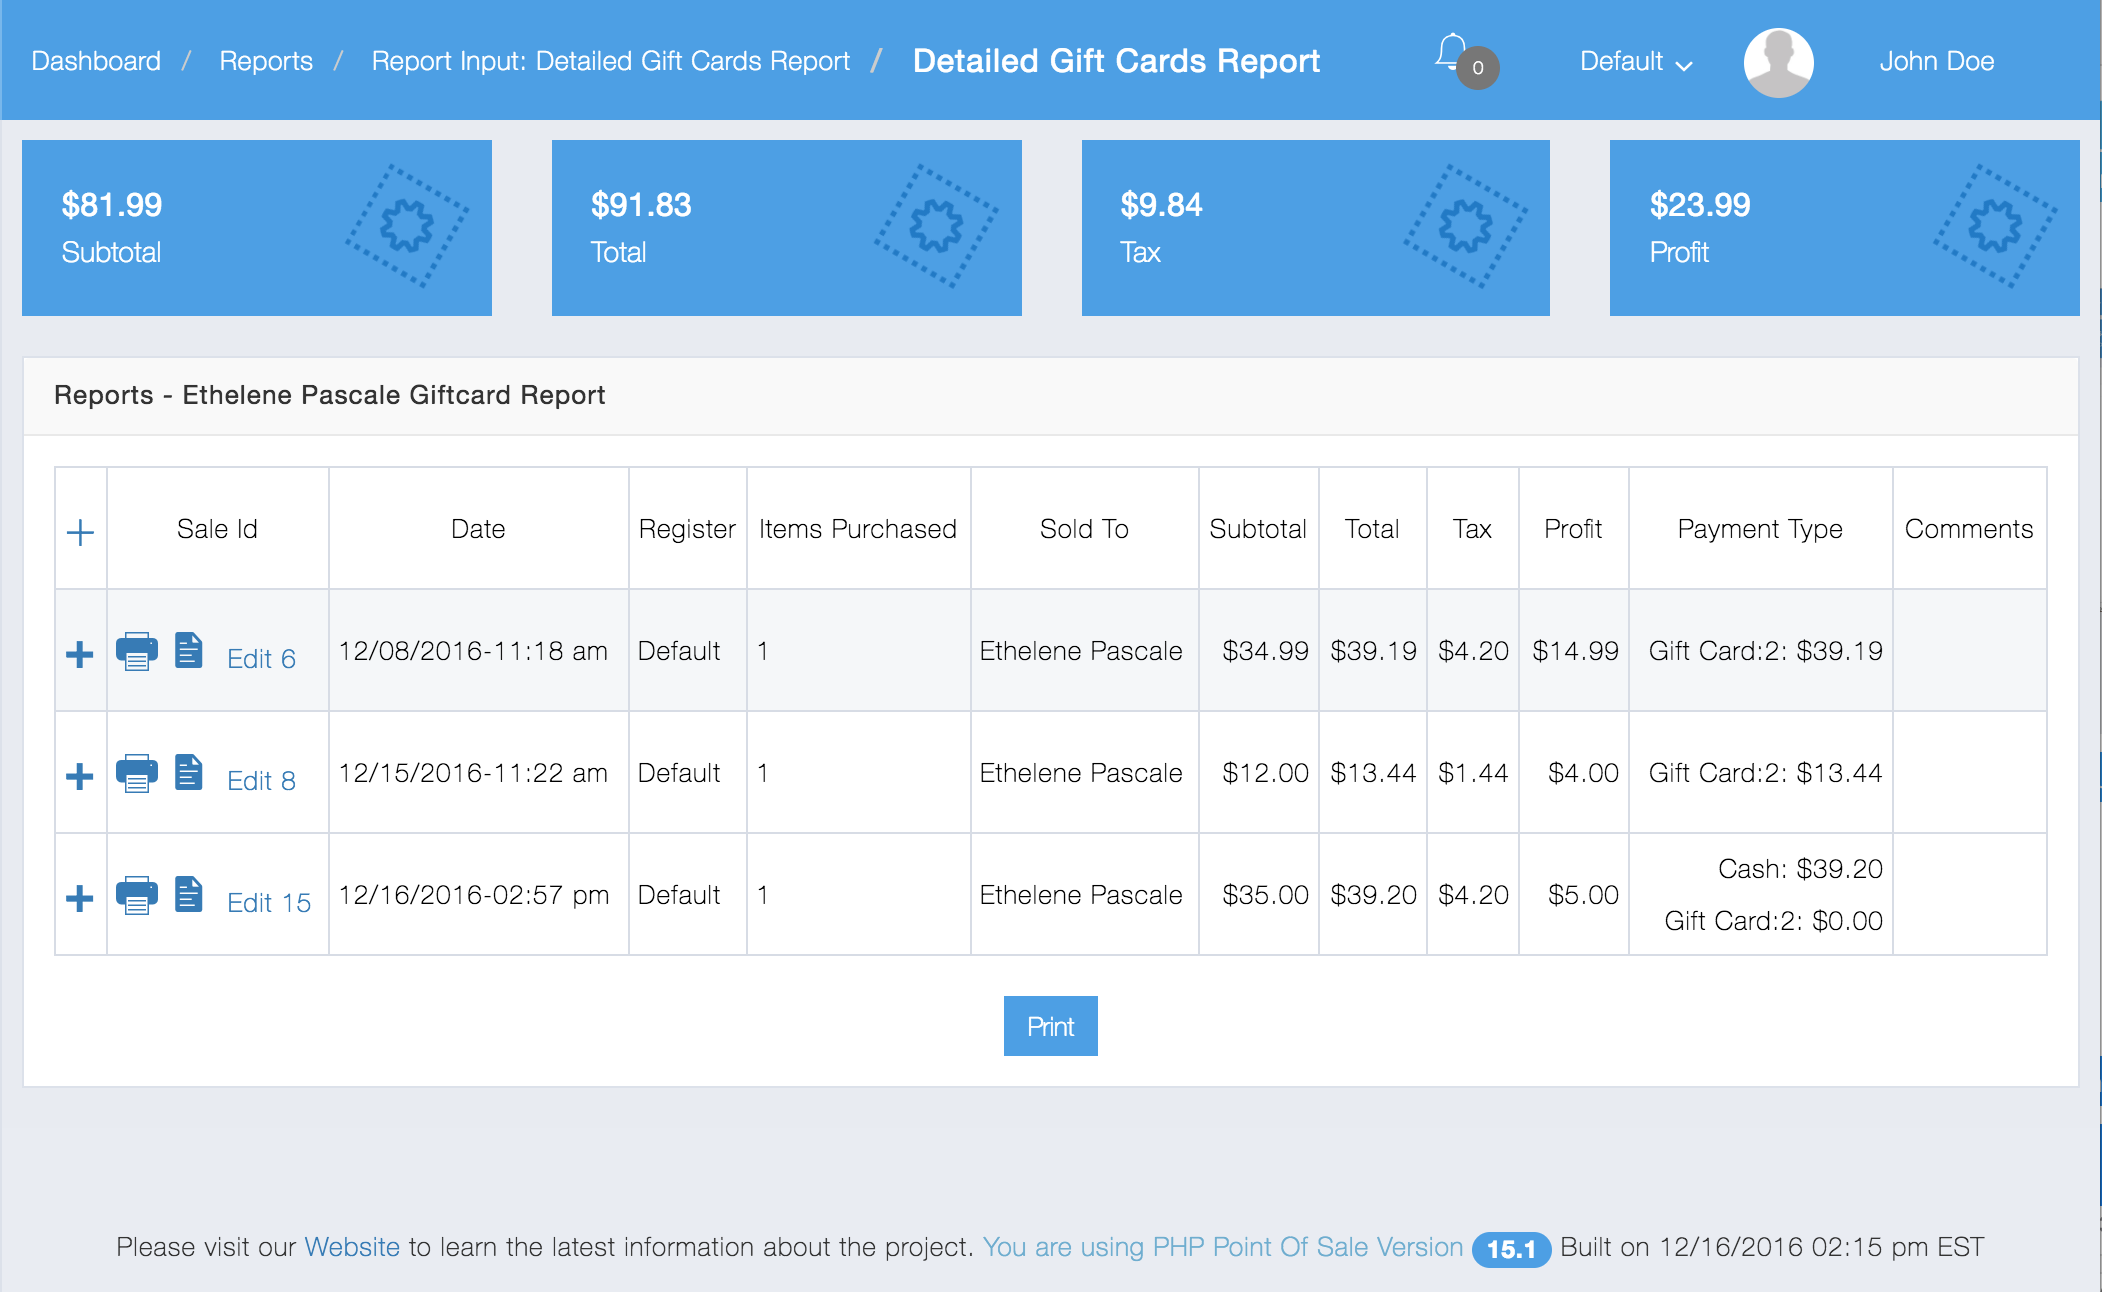
Here is an example of a Detailed Gift Cards Report for a particular customer:
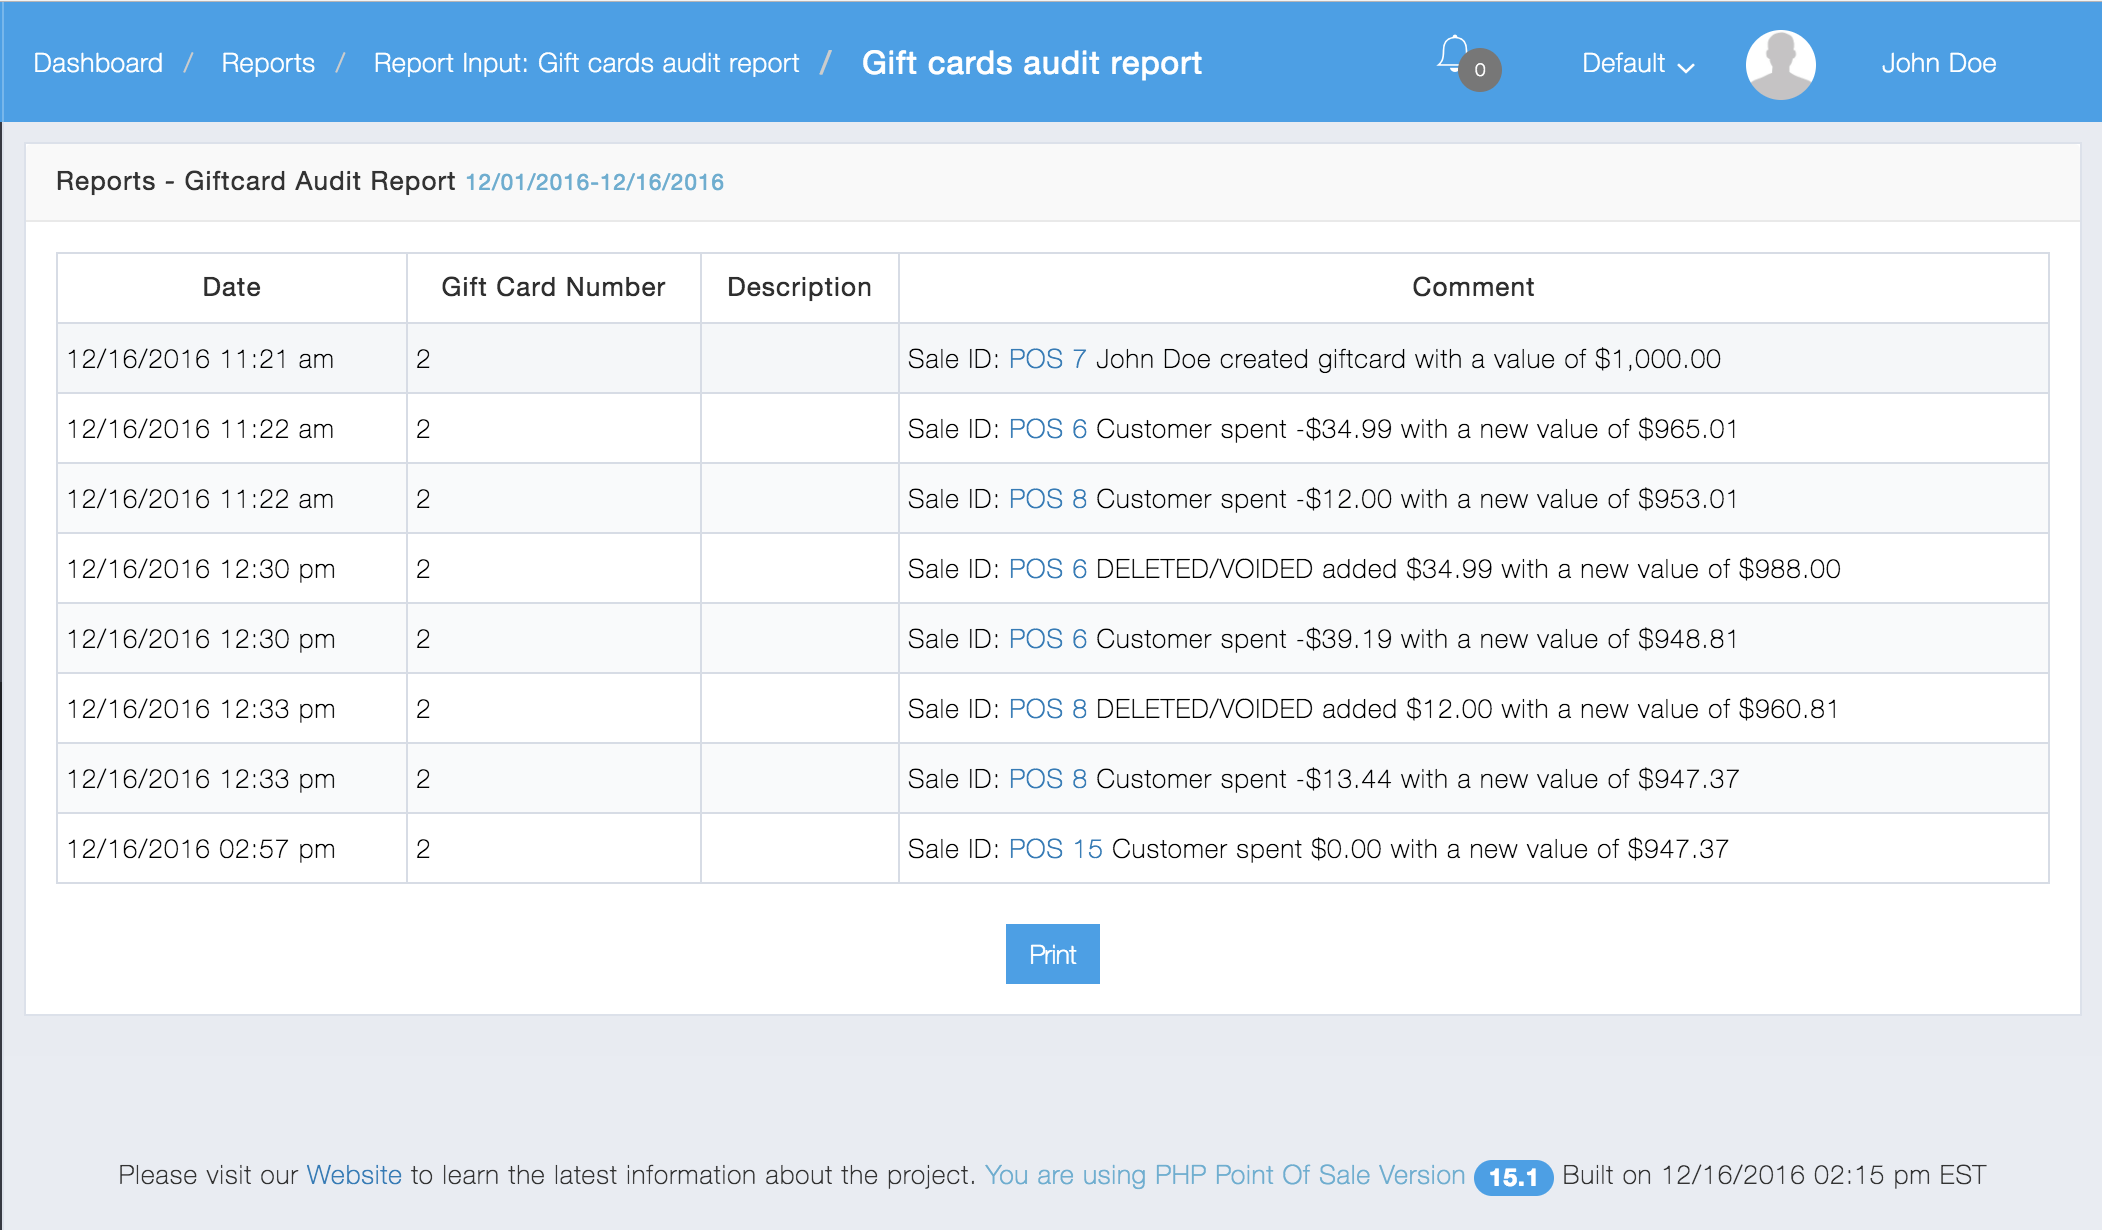
Here is an example of a Gift Card Audit Report
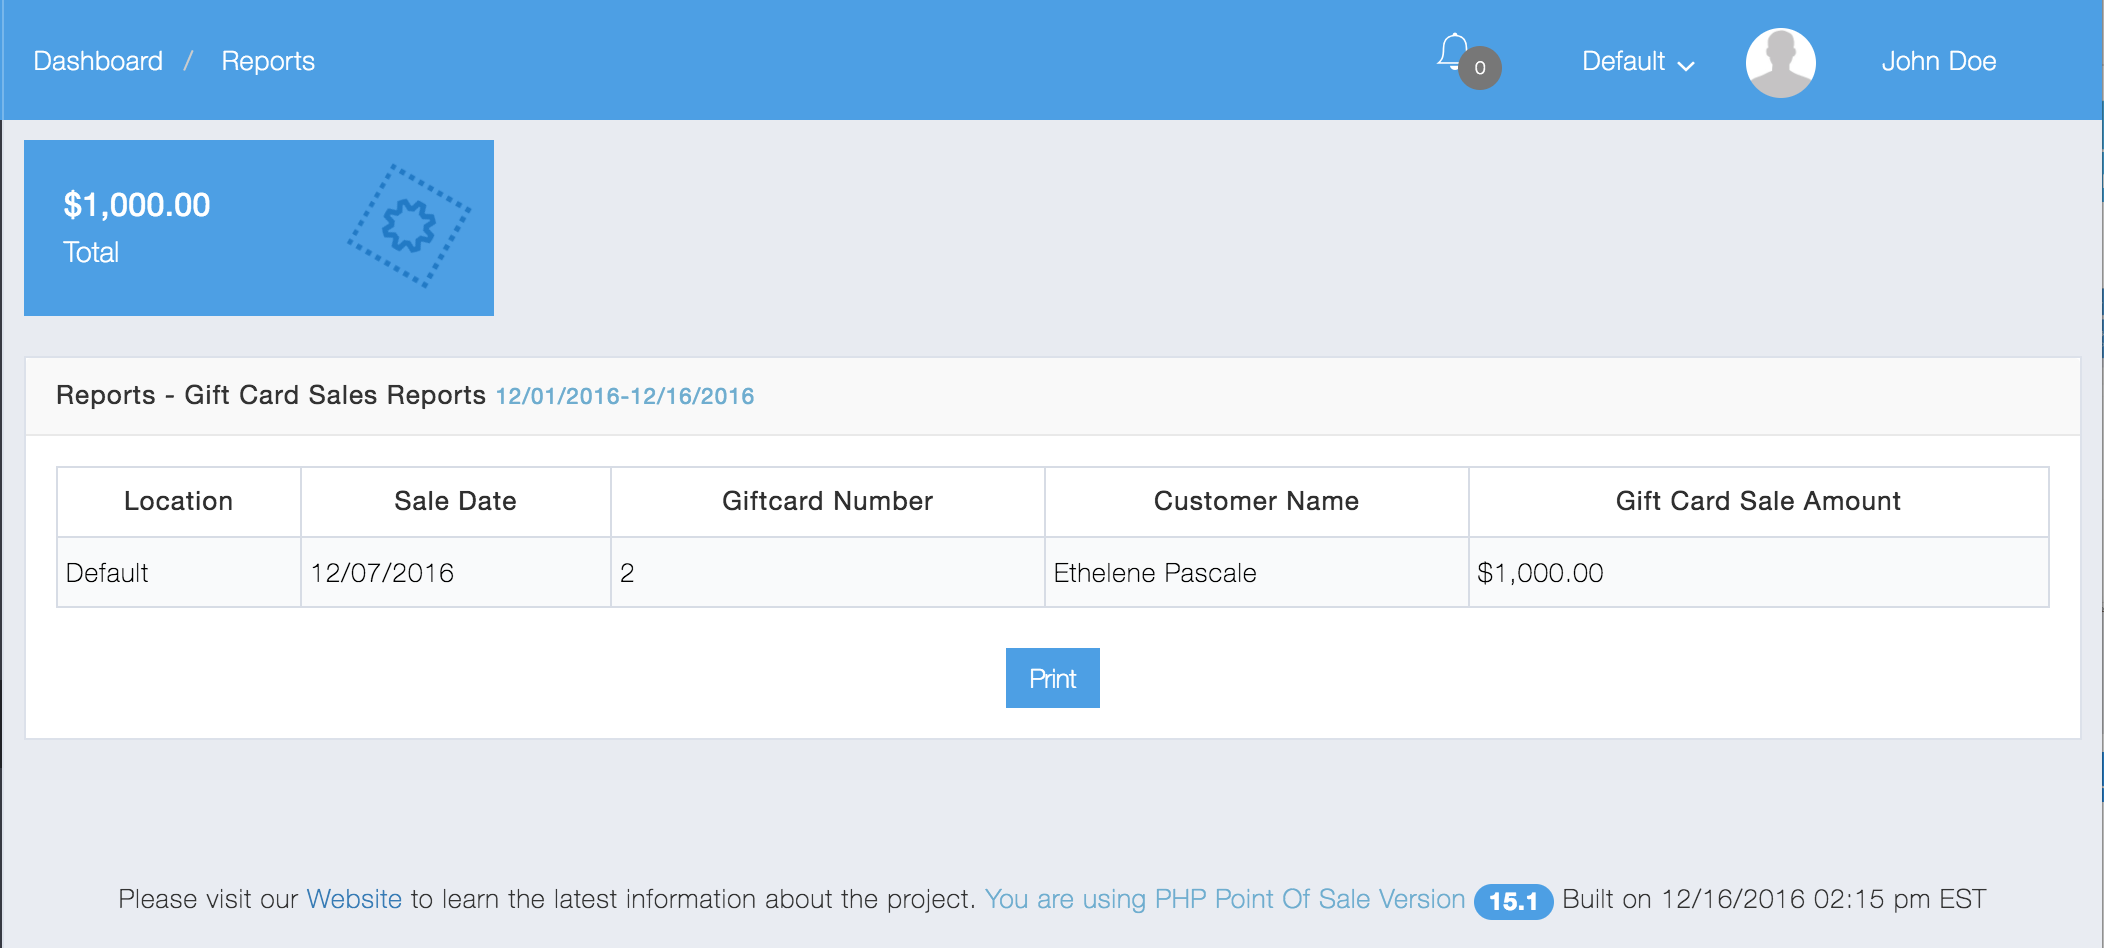
Lastly, here is an example of a Gift Card Sales Report:
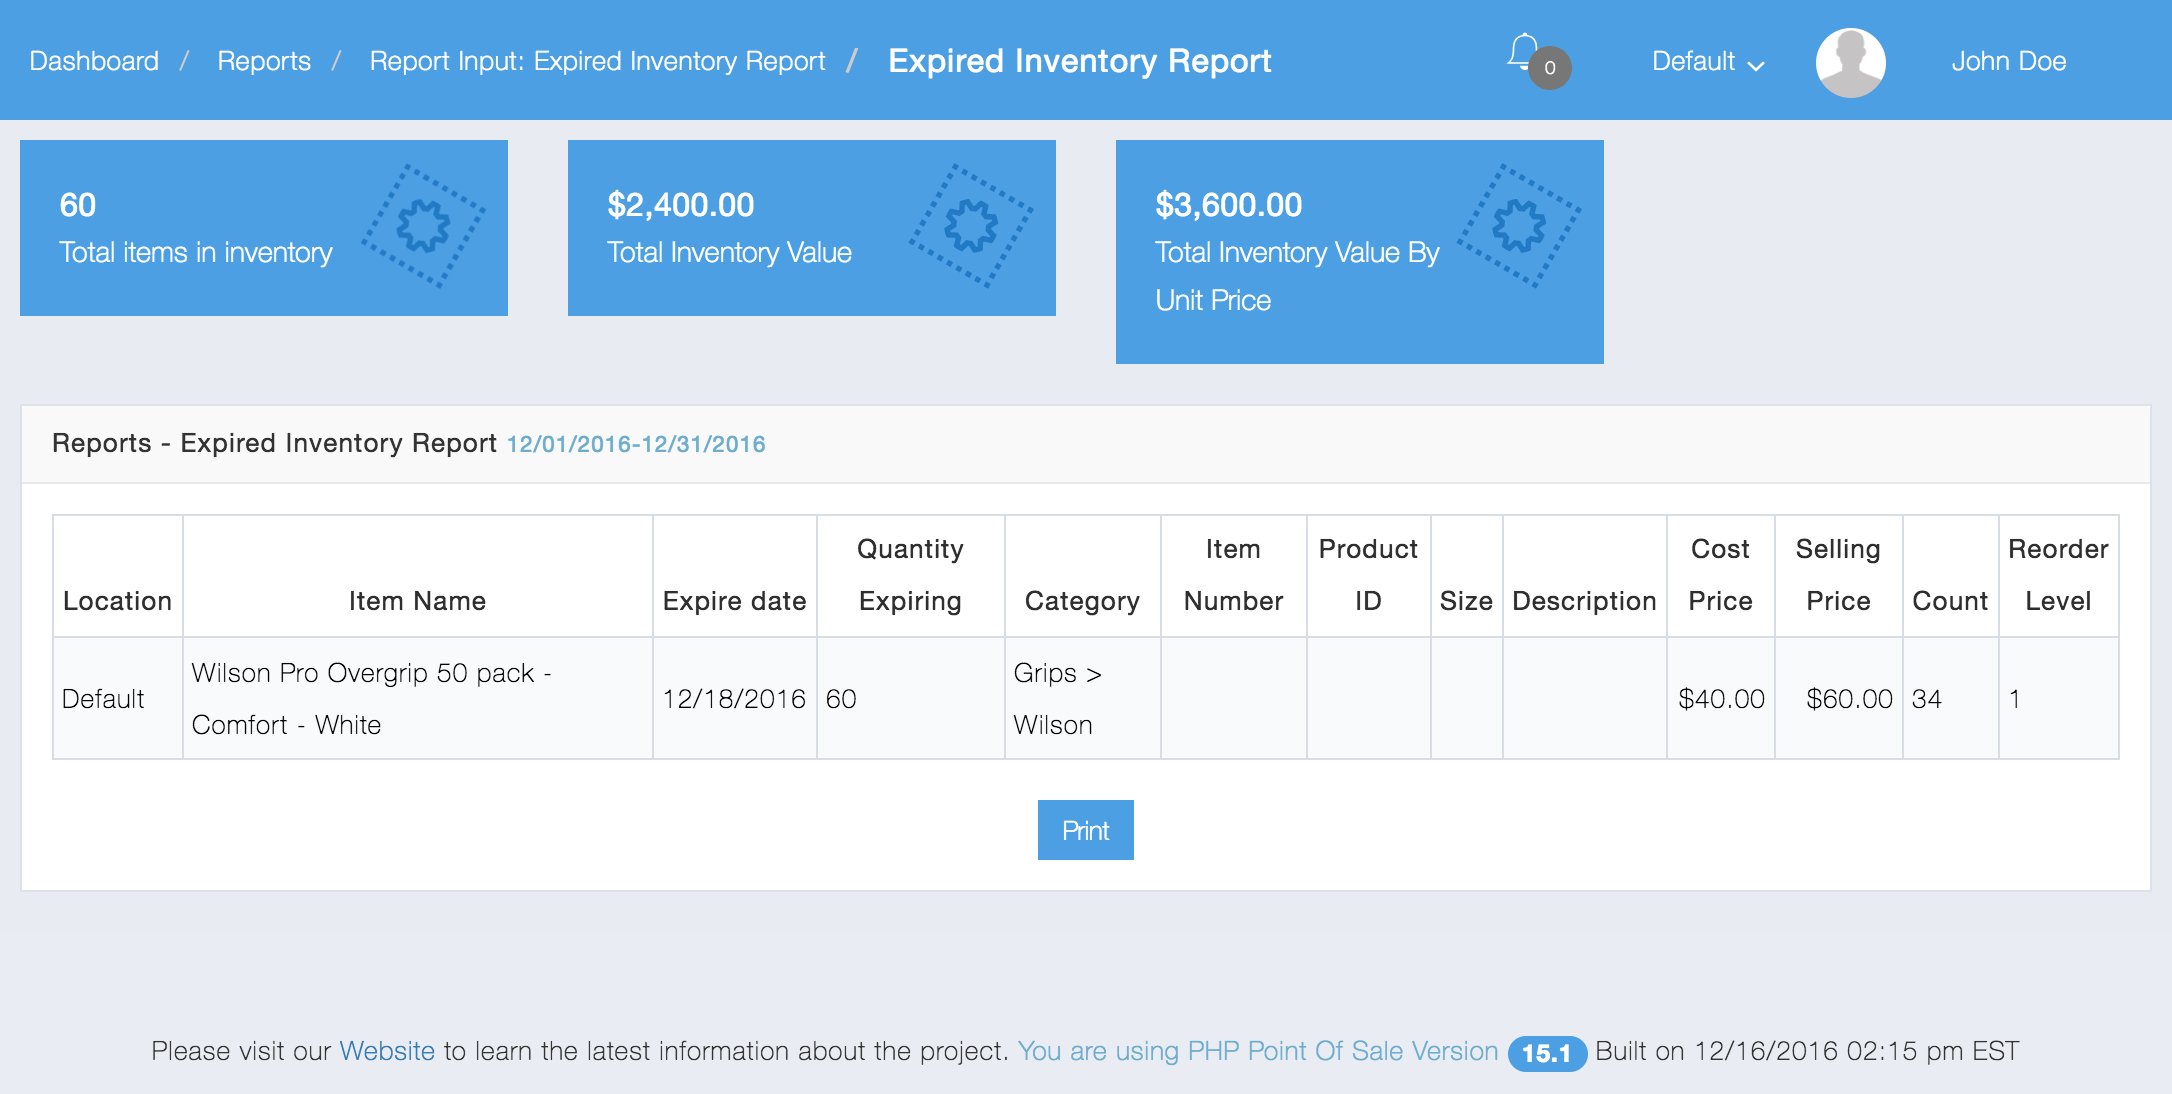
These reports allow you to audit or view all Inventory. It also lets you look at expiring inventory.
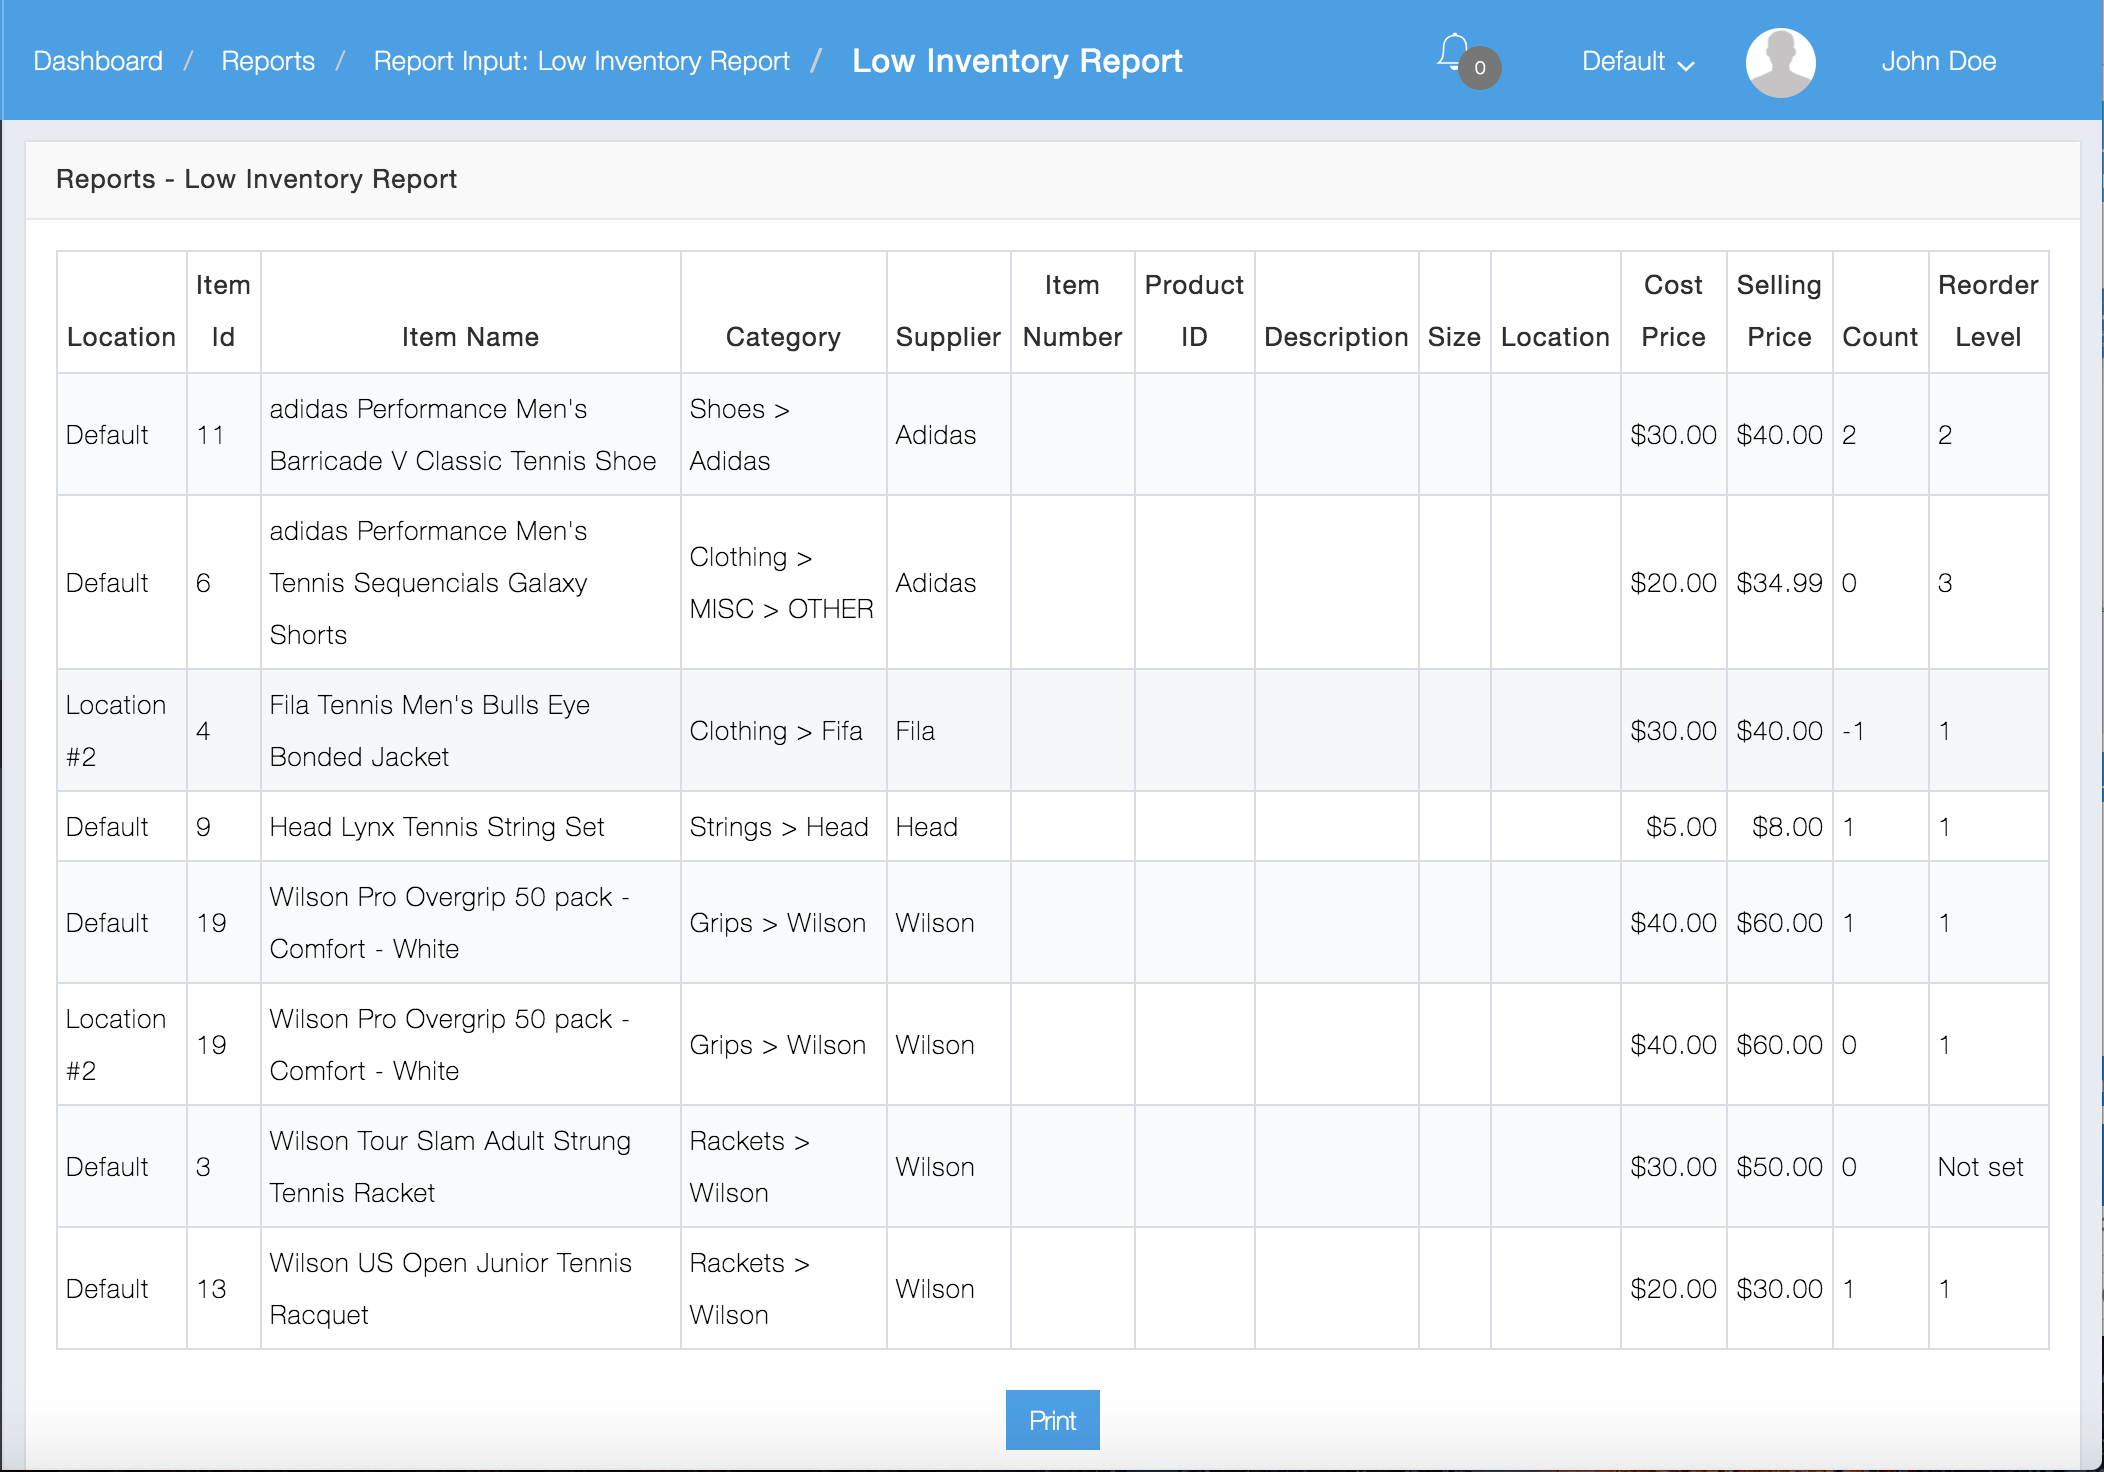
Here is an example of a Low Inventory Report
Here is an example of an Inventory Summary Report:
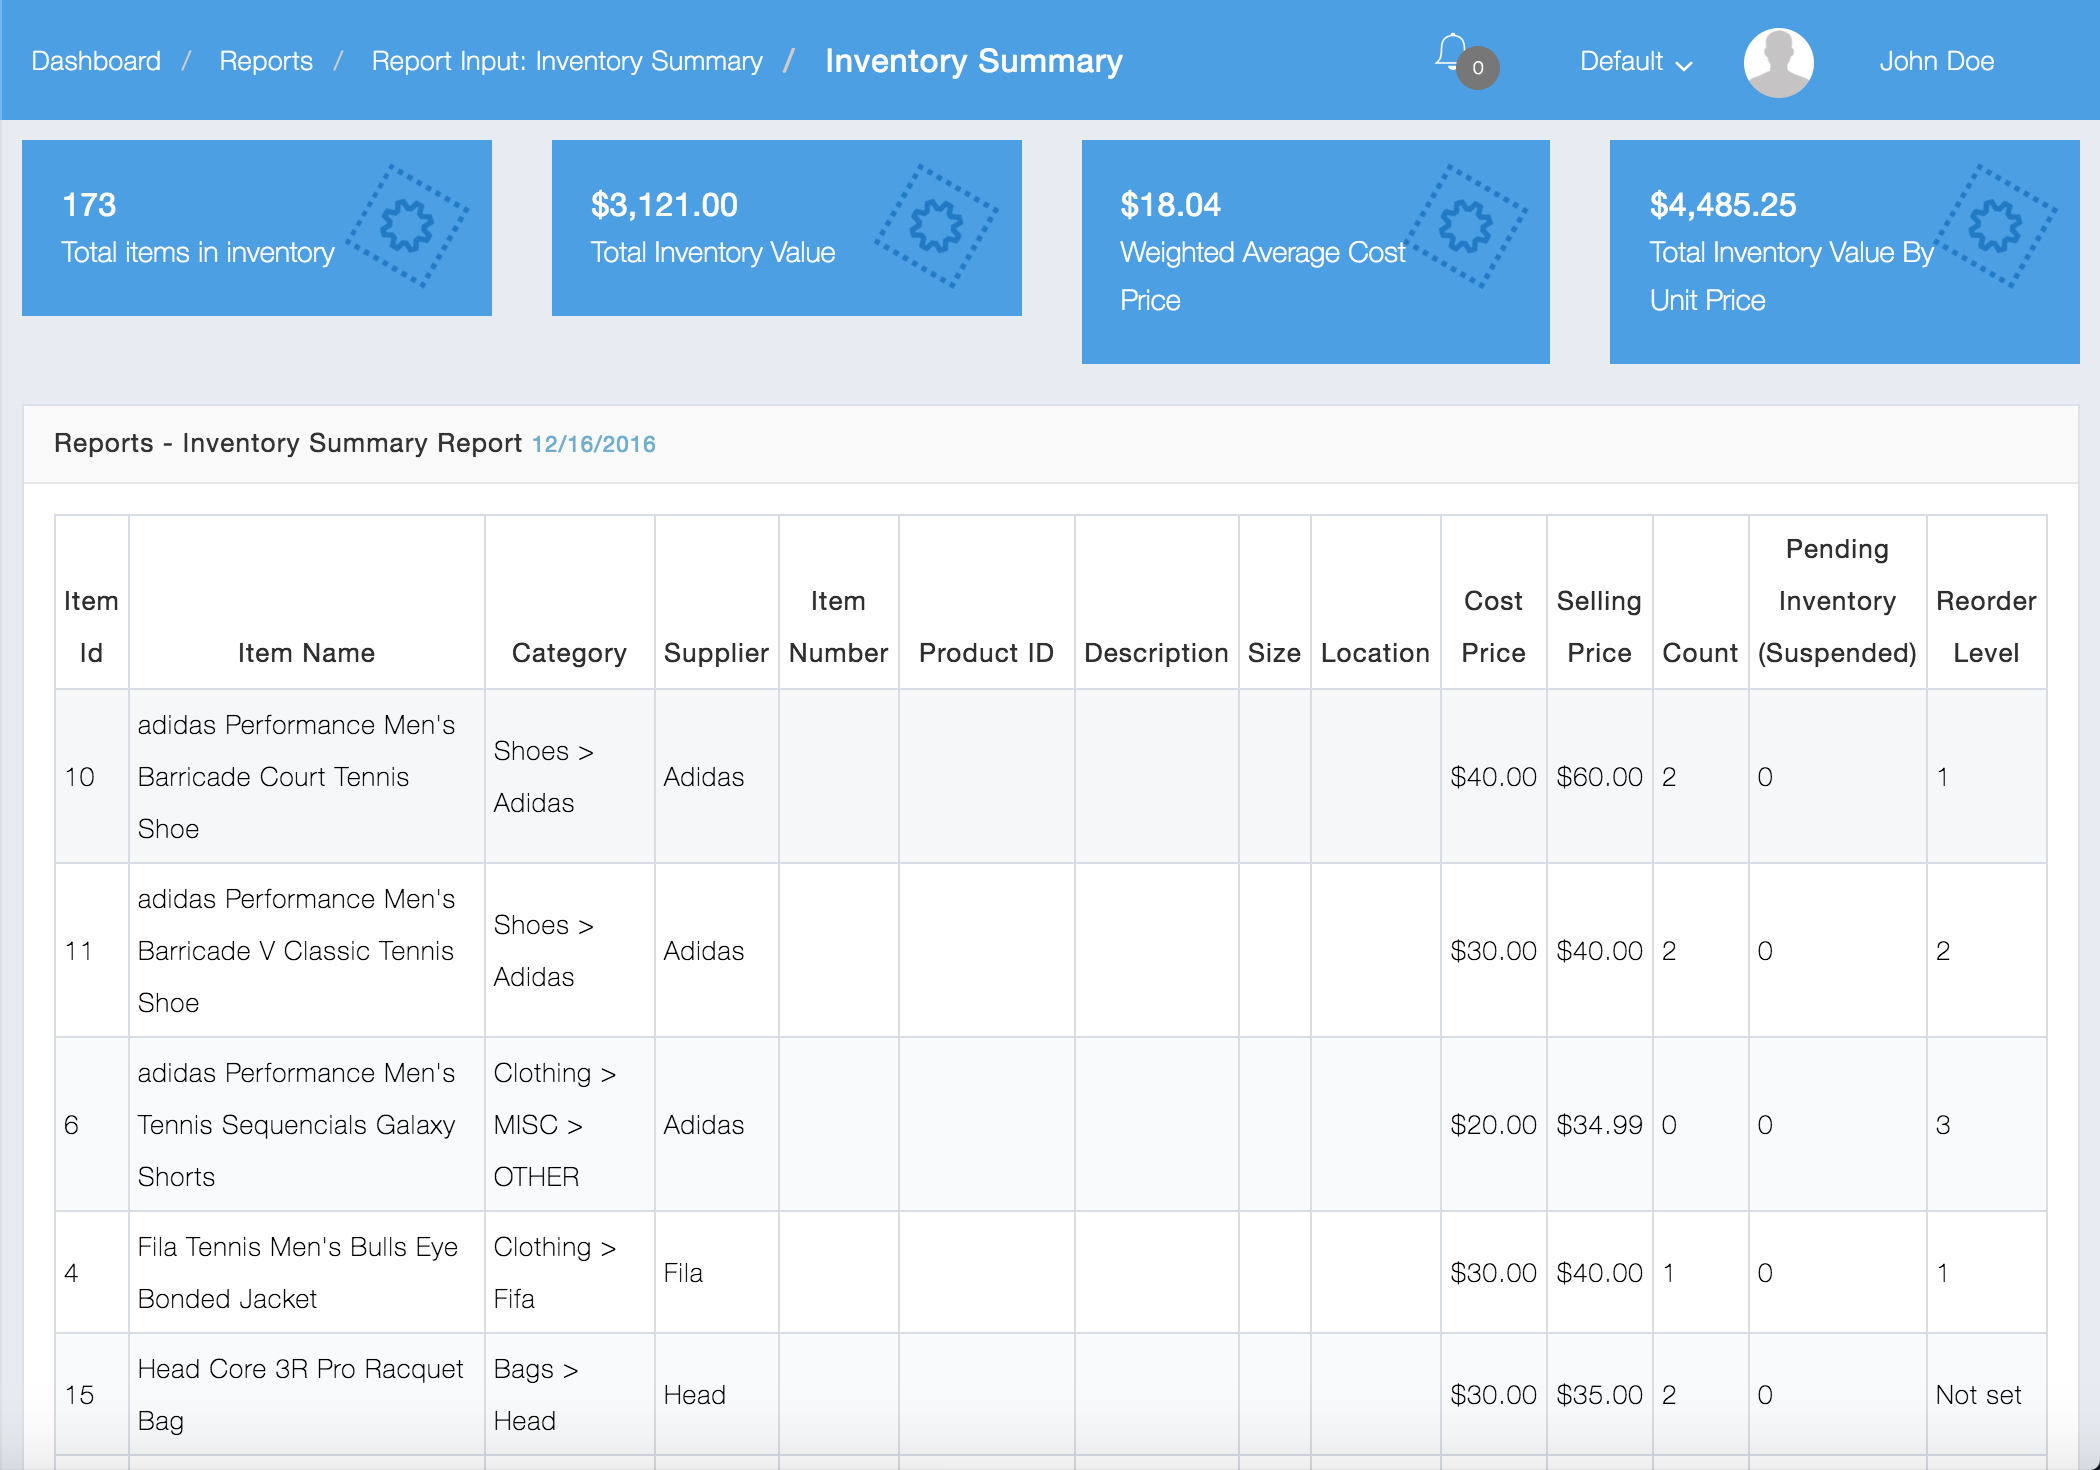
Added option to inventory summary report “Show Deleted Items”
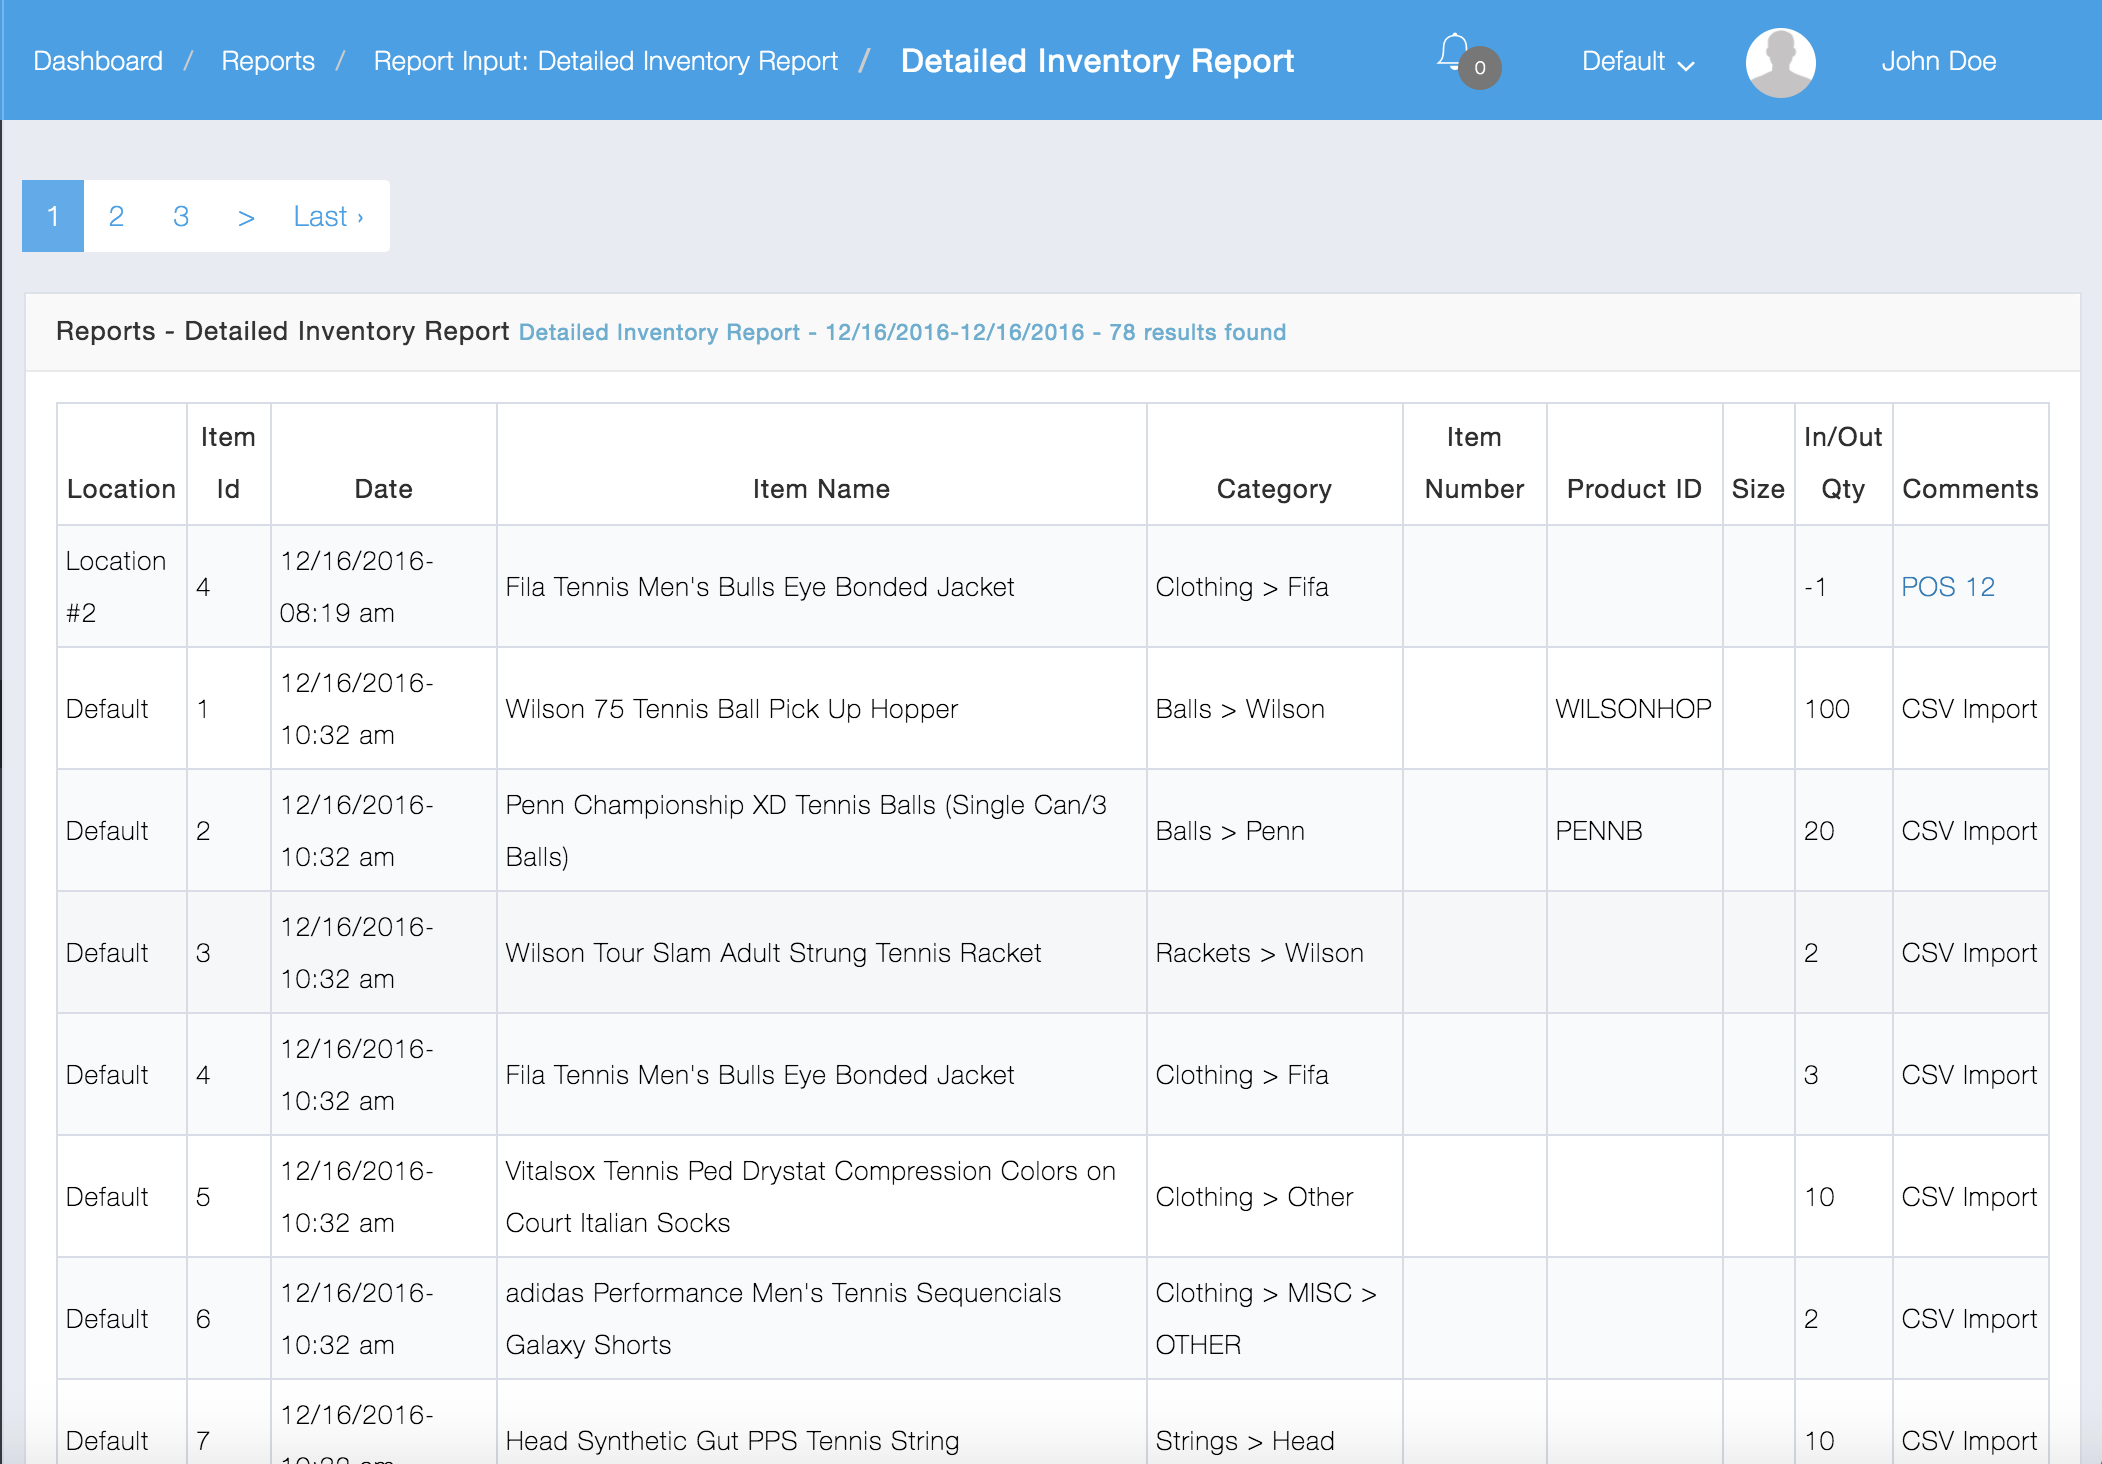
Here is an Example of a Detailed Inventory Report
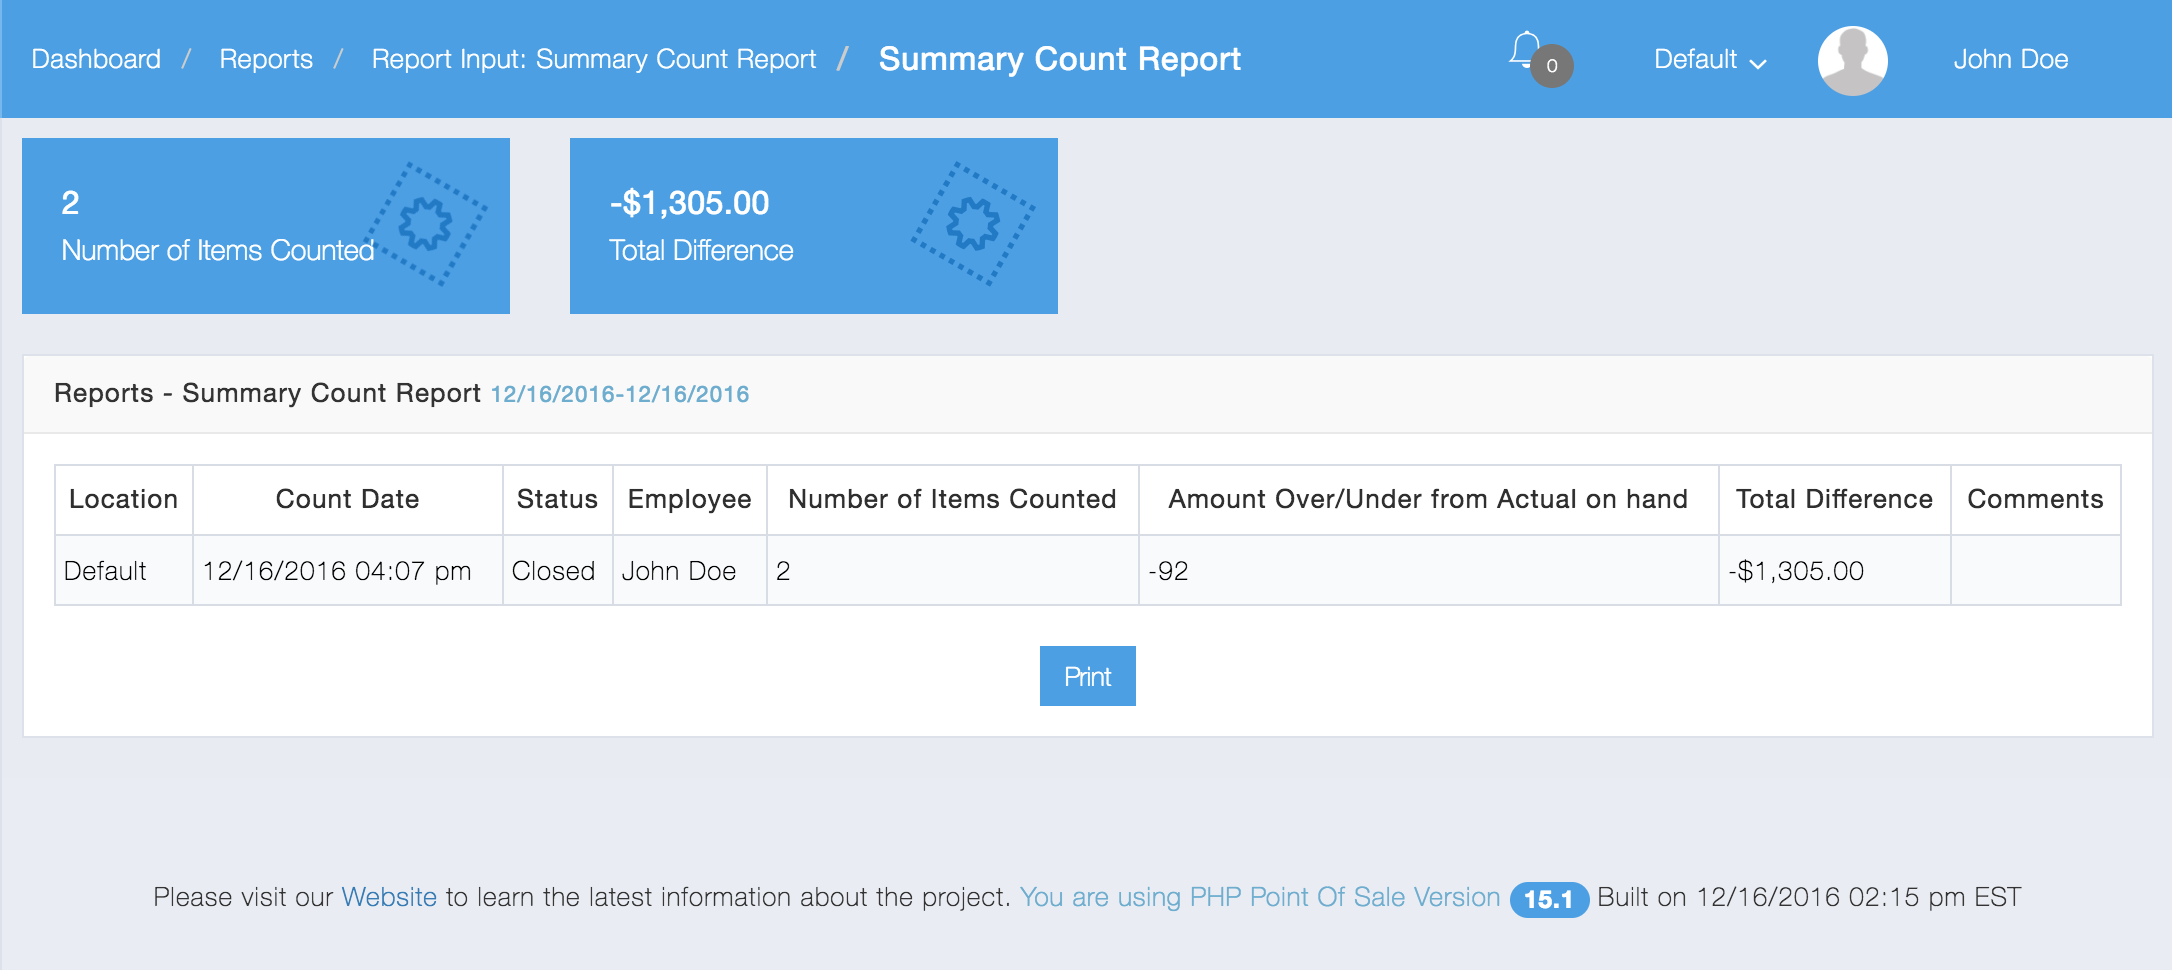
Here is an example of a Summary Count Report:
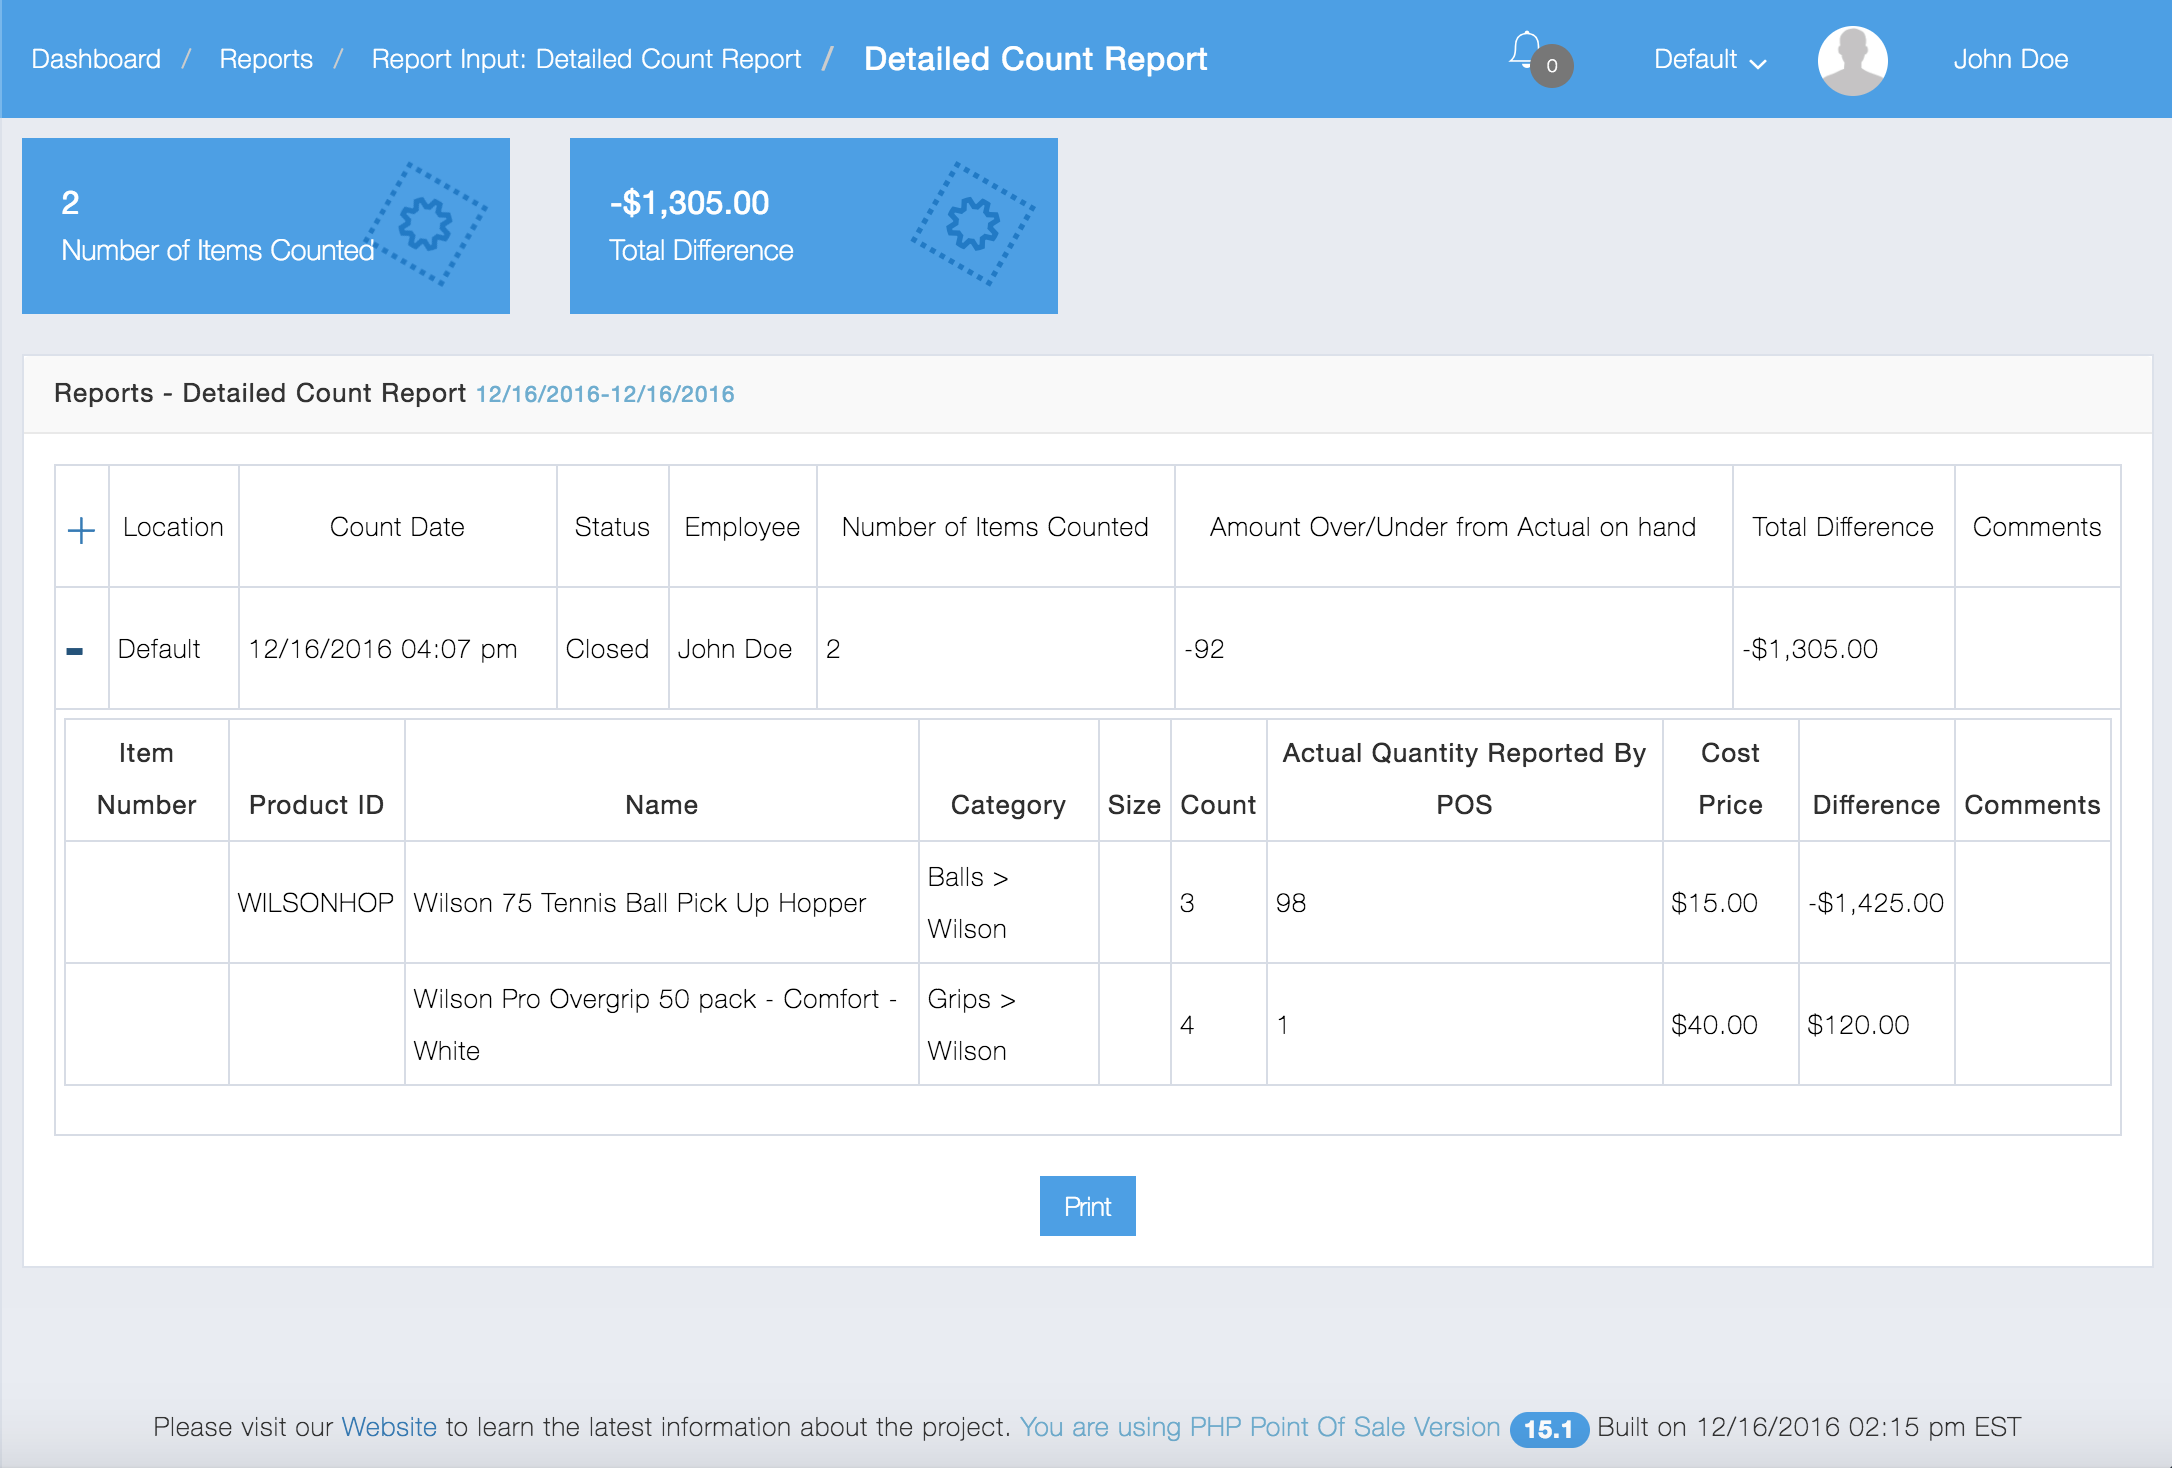
Here is an example of a Detailed Count Report:
Here is an example of an Expiring Inventory Report
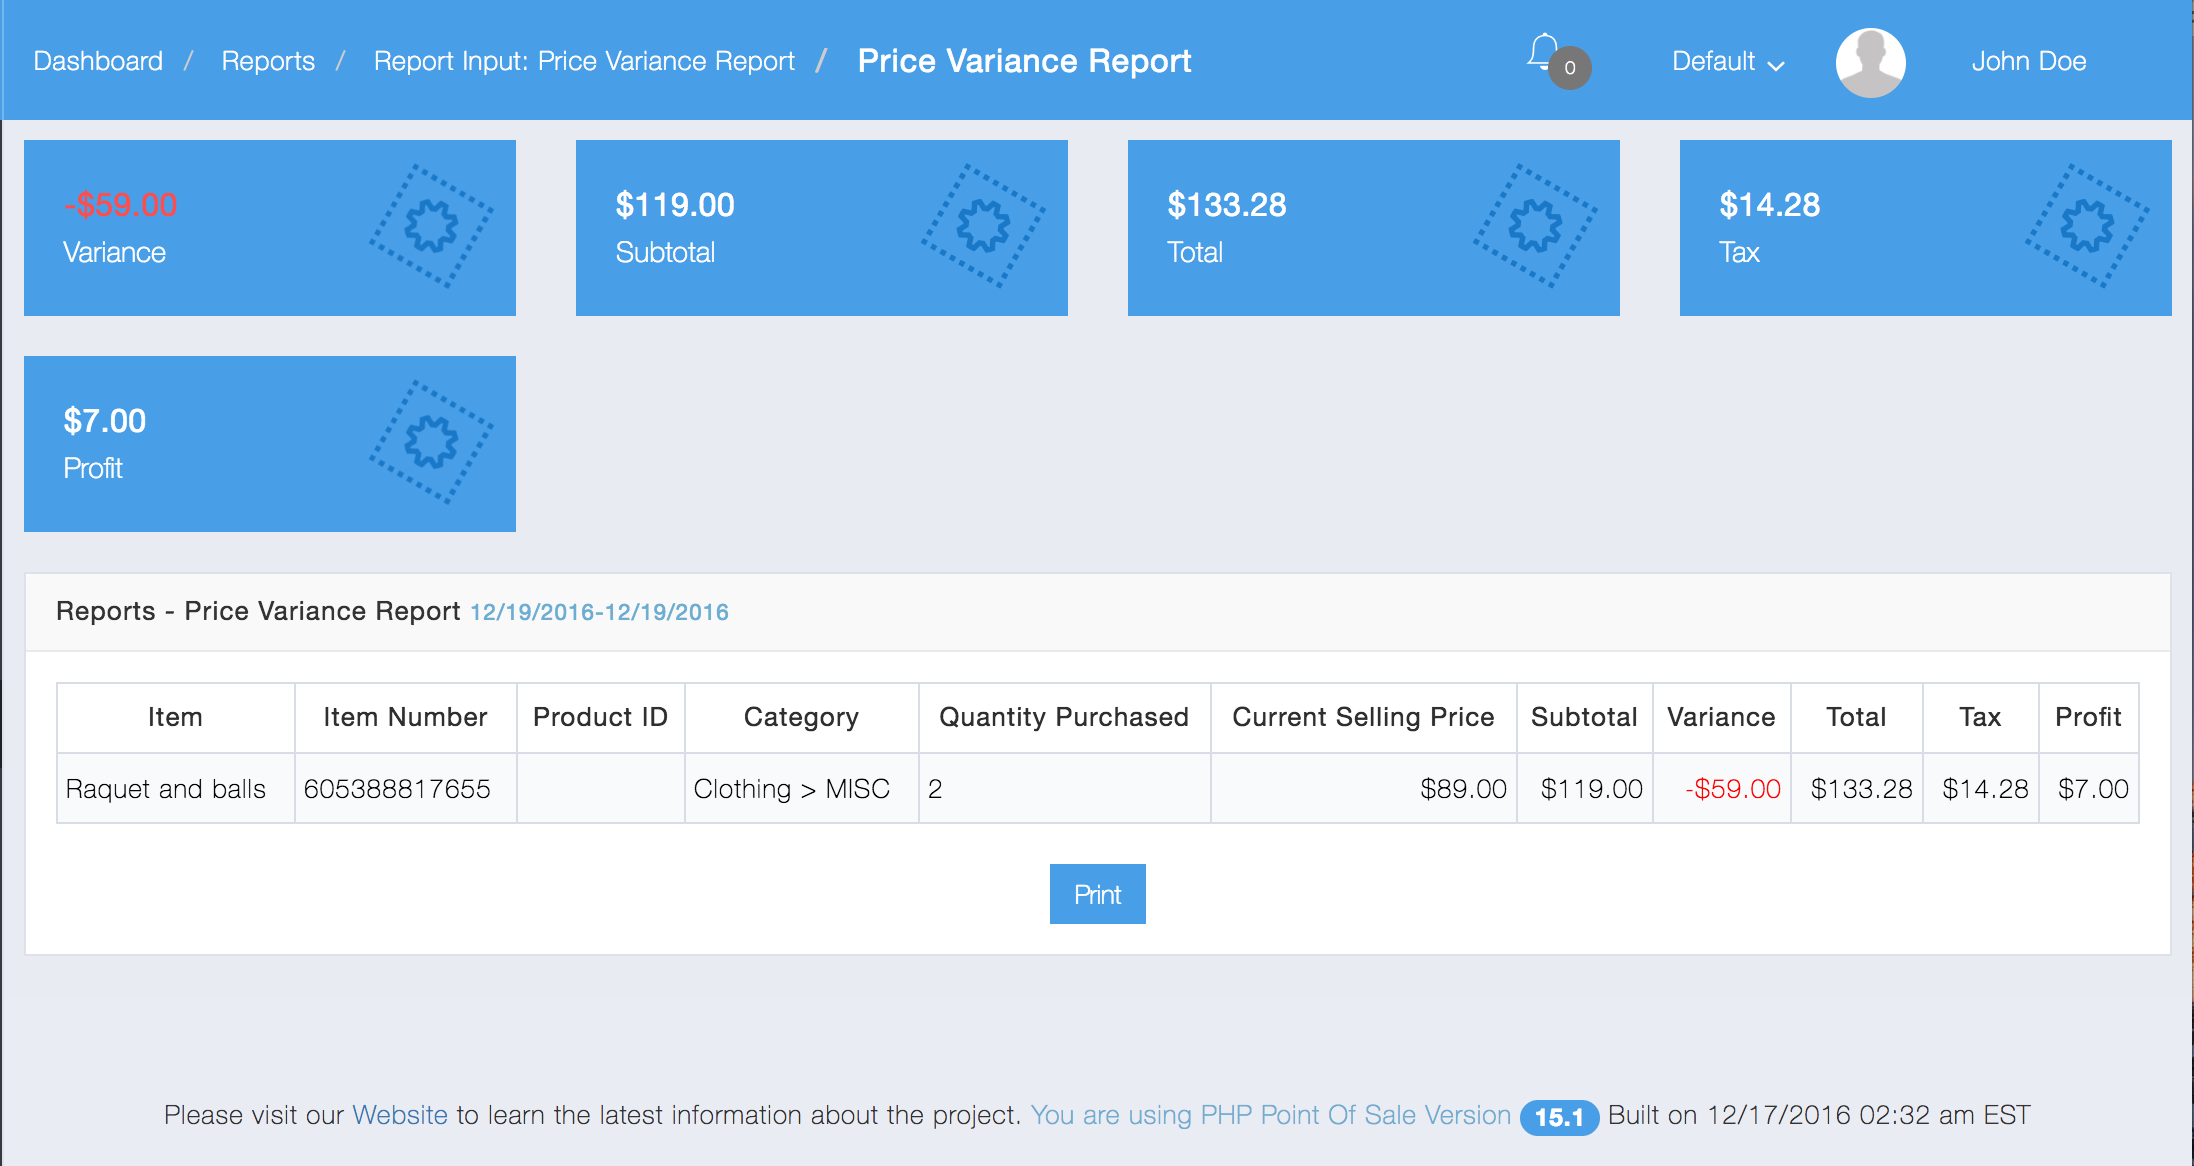
These reports let you look at sales of item kits. There is also a price variance report.
Here is an example of a Item Kits Graphical Summary Report which breaks down sales of items kits:
Here is an example of a Price Variance Report which measures the variance in prices of item kits at the time of sale:
These reports let you look at sales of items. There is also a price variance report, similar to that of item kits.
Below is an example of an Items Summary Report:

Manufacturers reports will be coming soon…
Lets you View Item sales based off of the manufacture listed on each item.
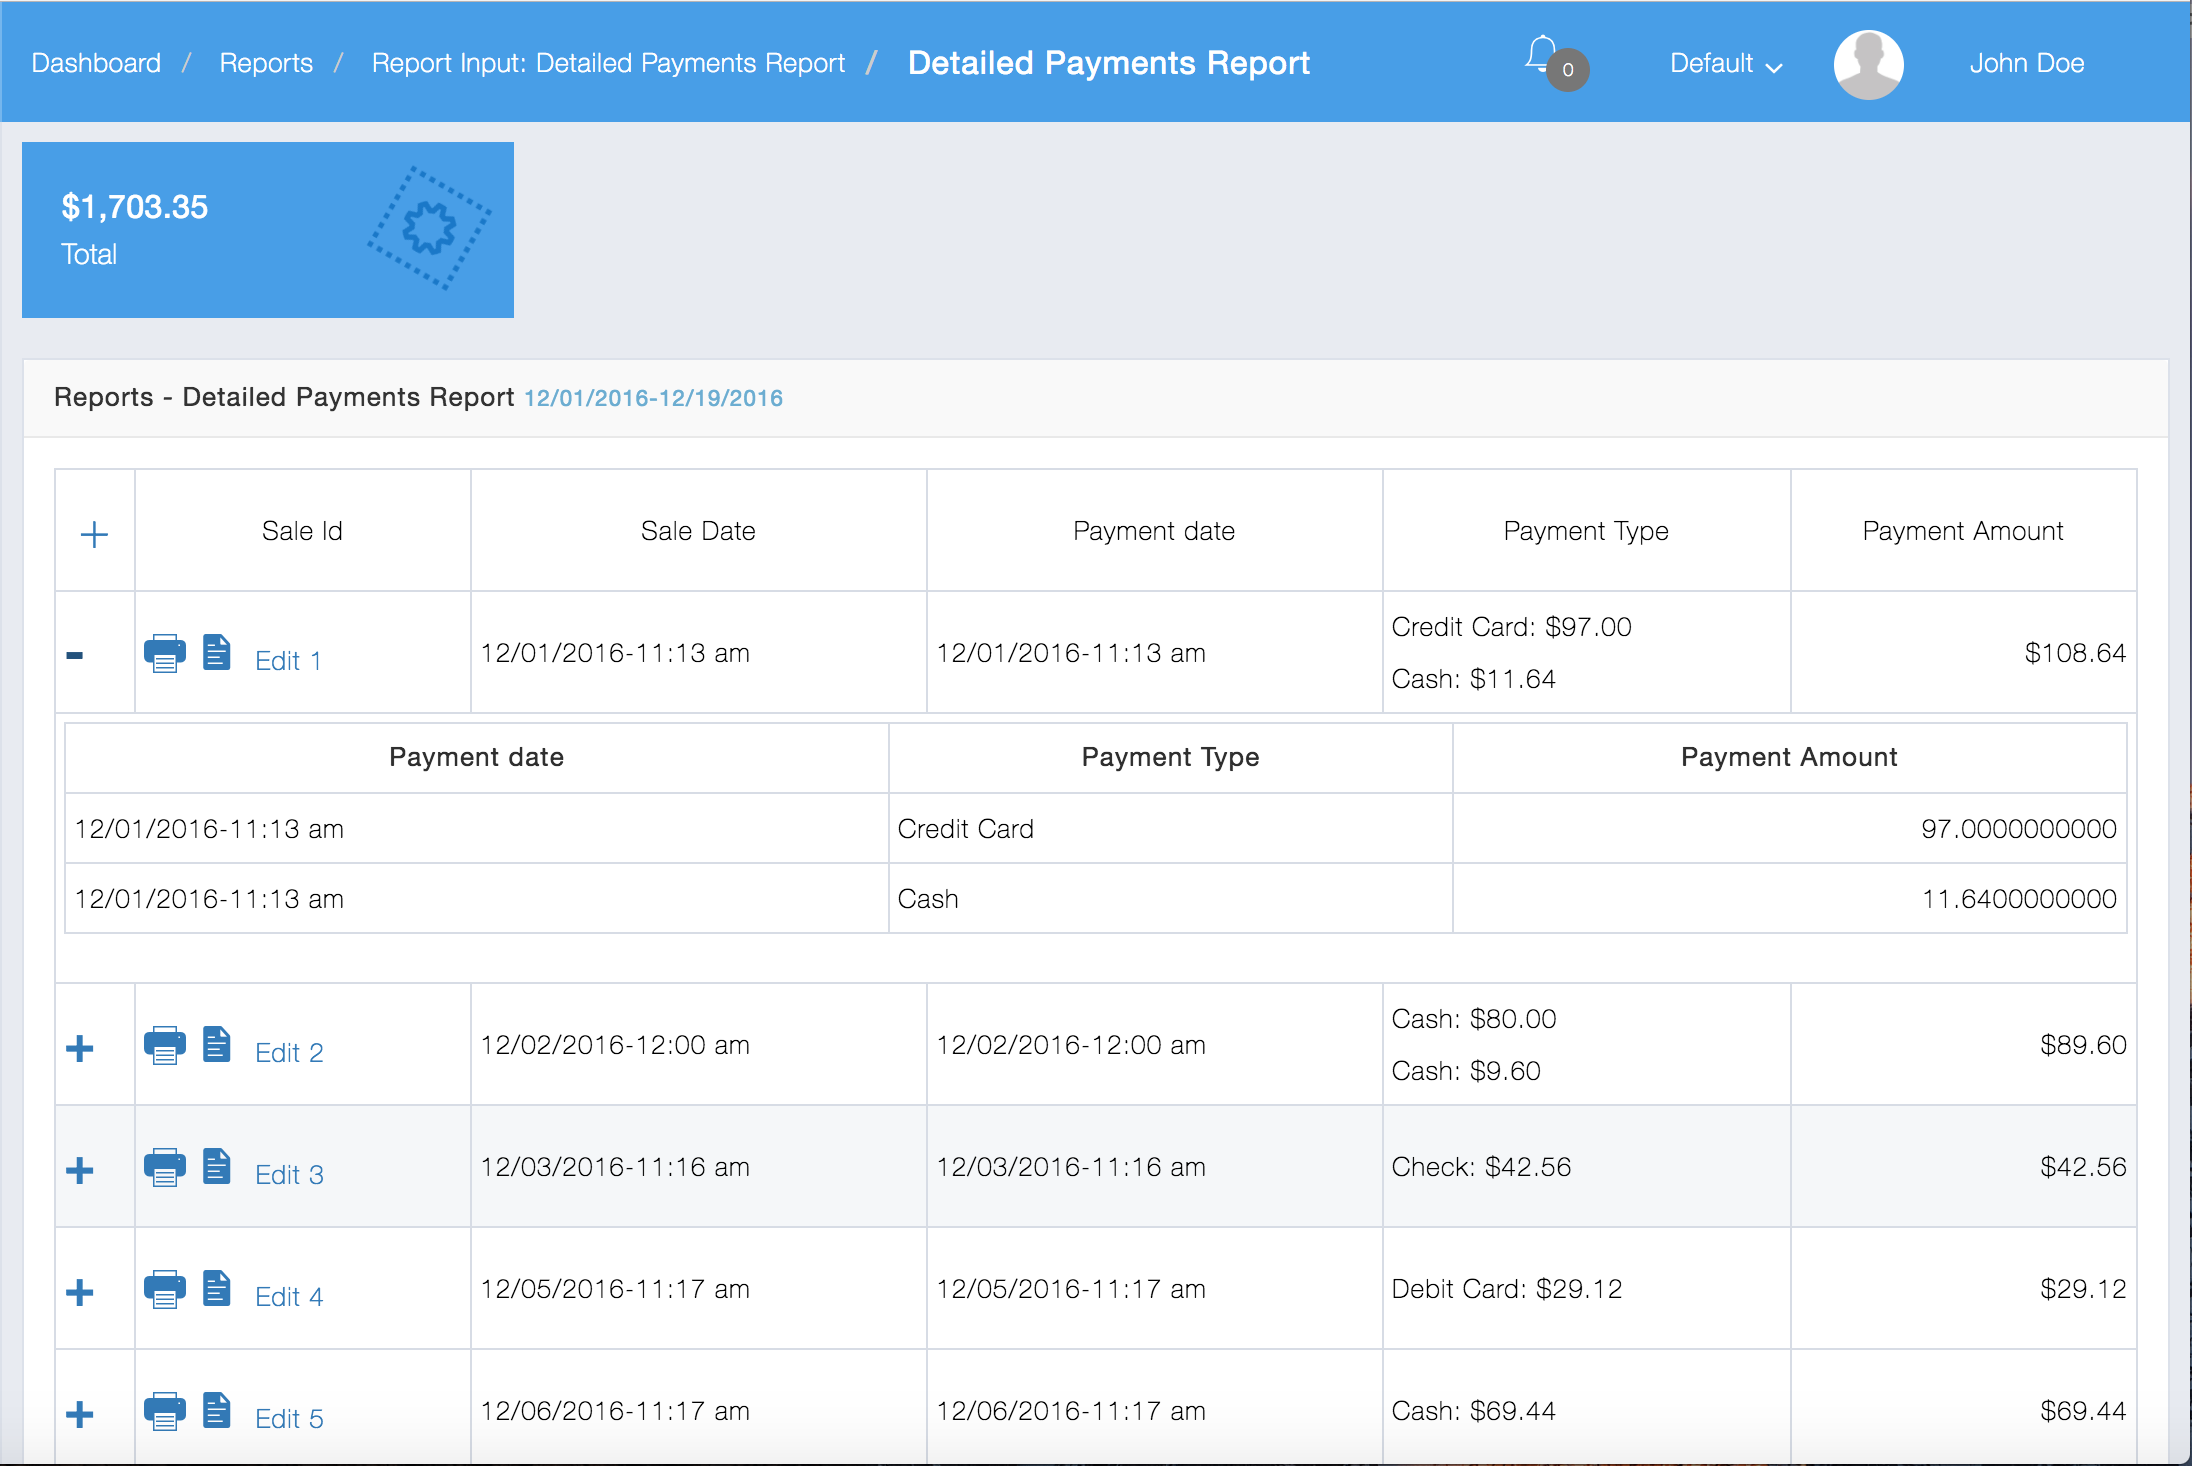
These reports let you view payments made by customers.
Here is an example of a Detailed Payments Report:
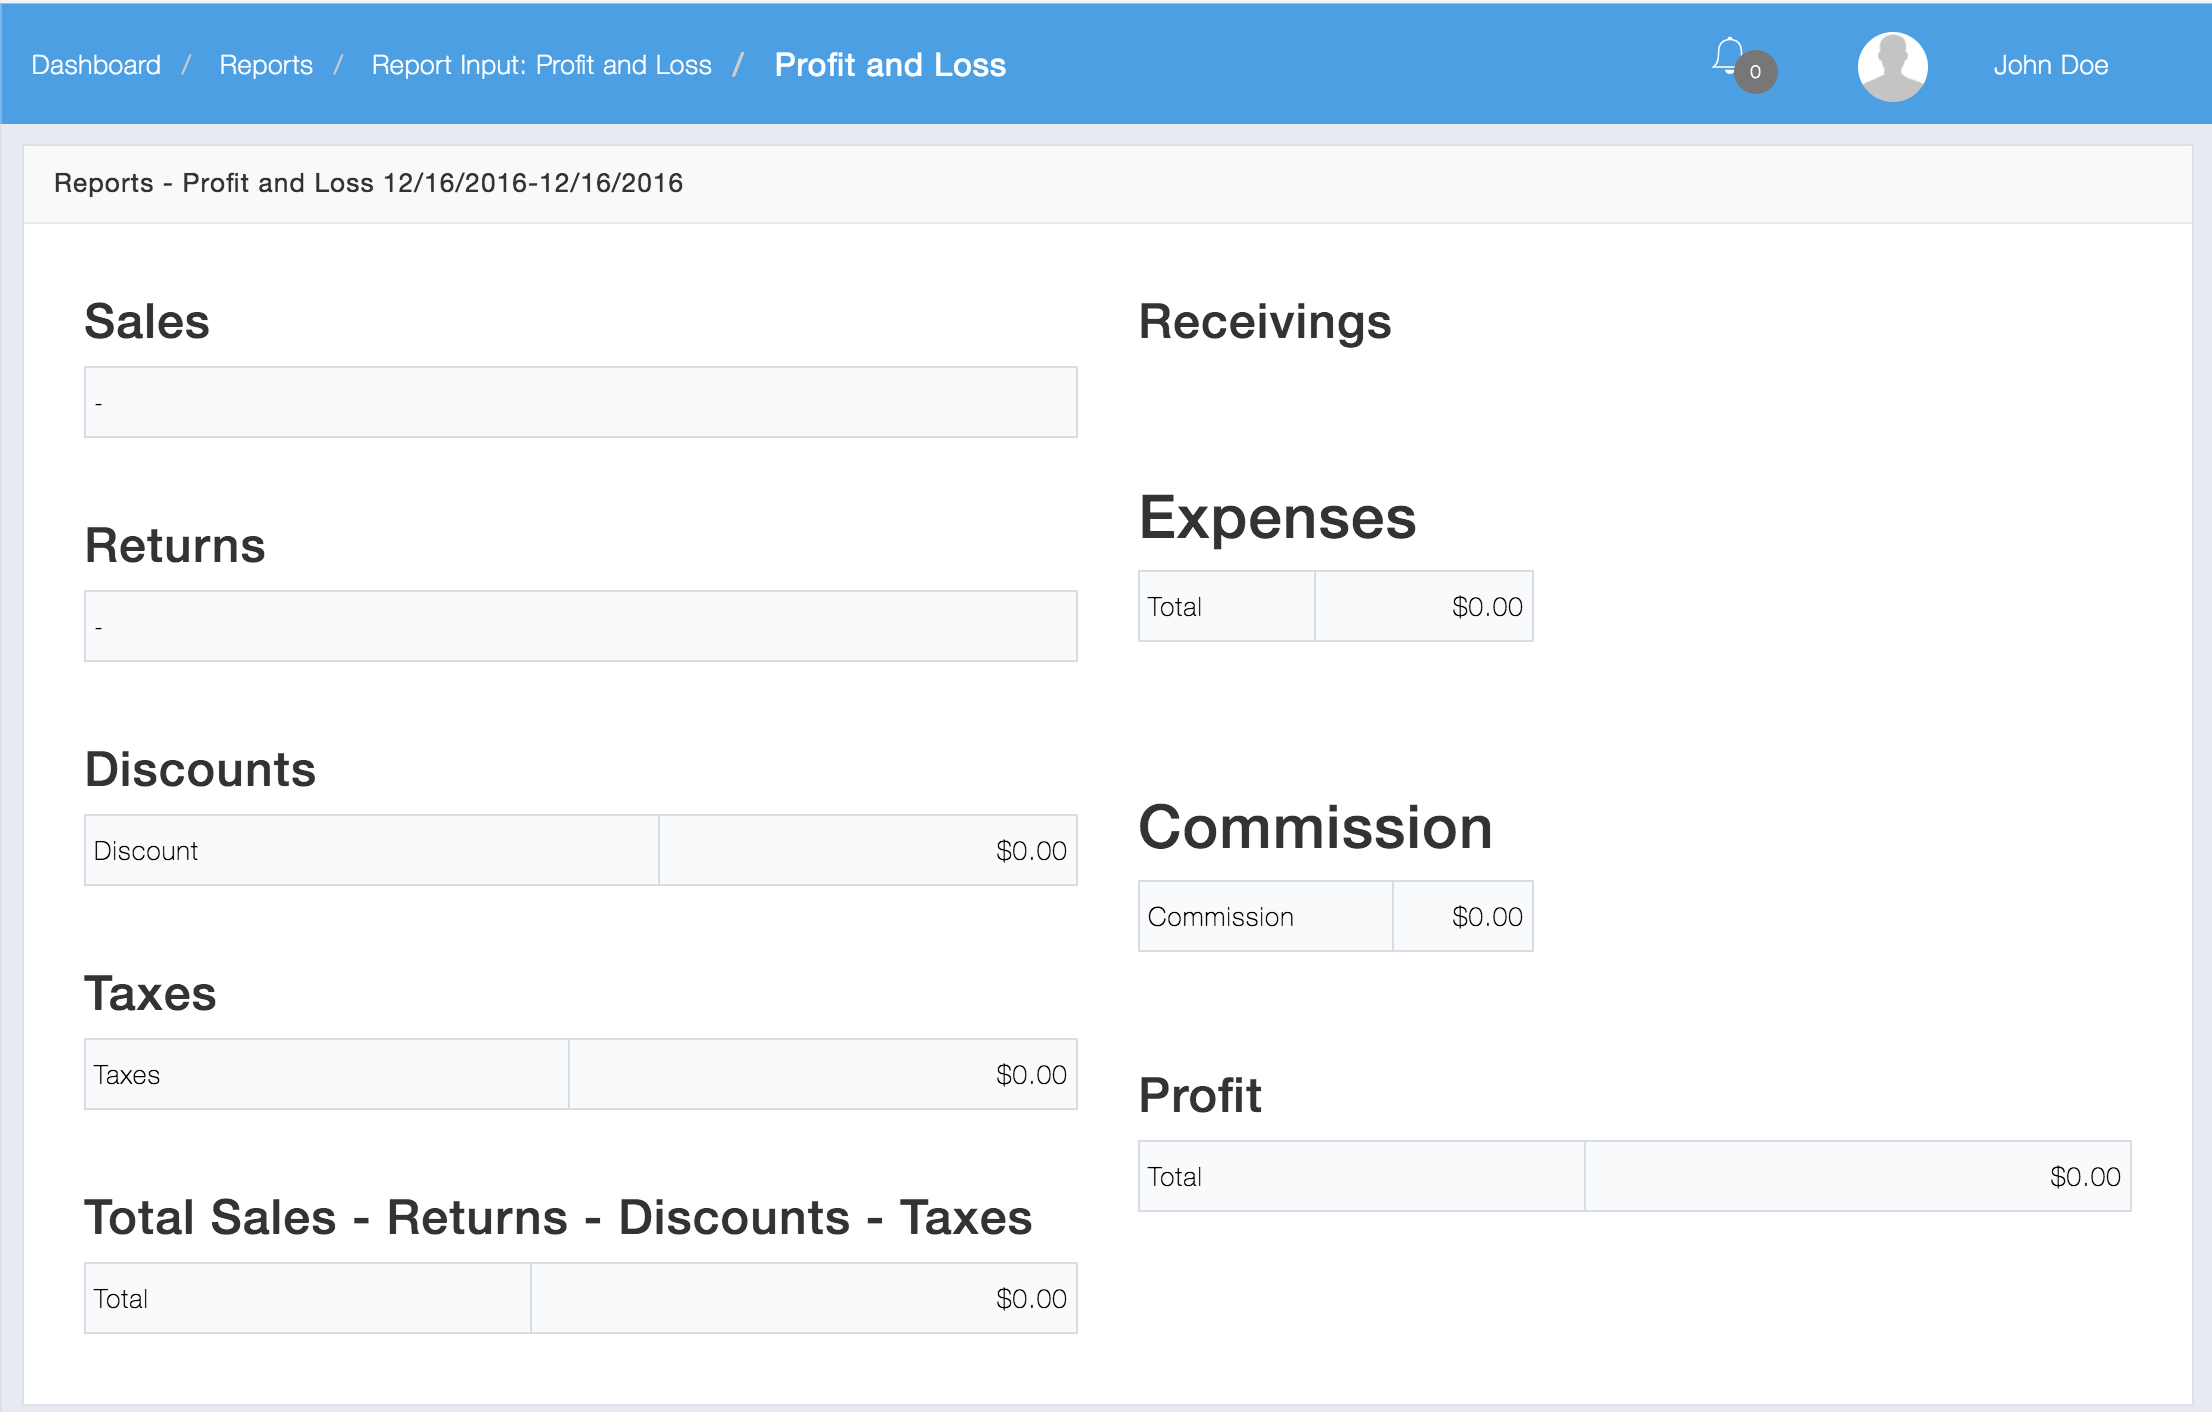
This report shows statistics on sales.
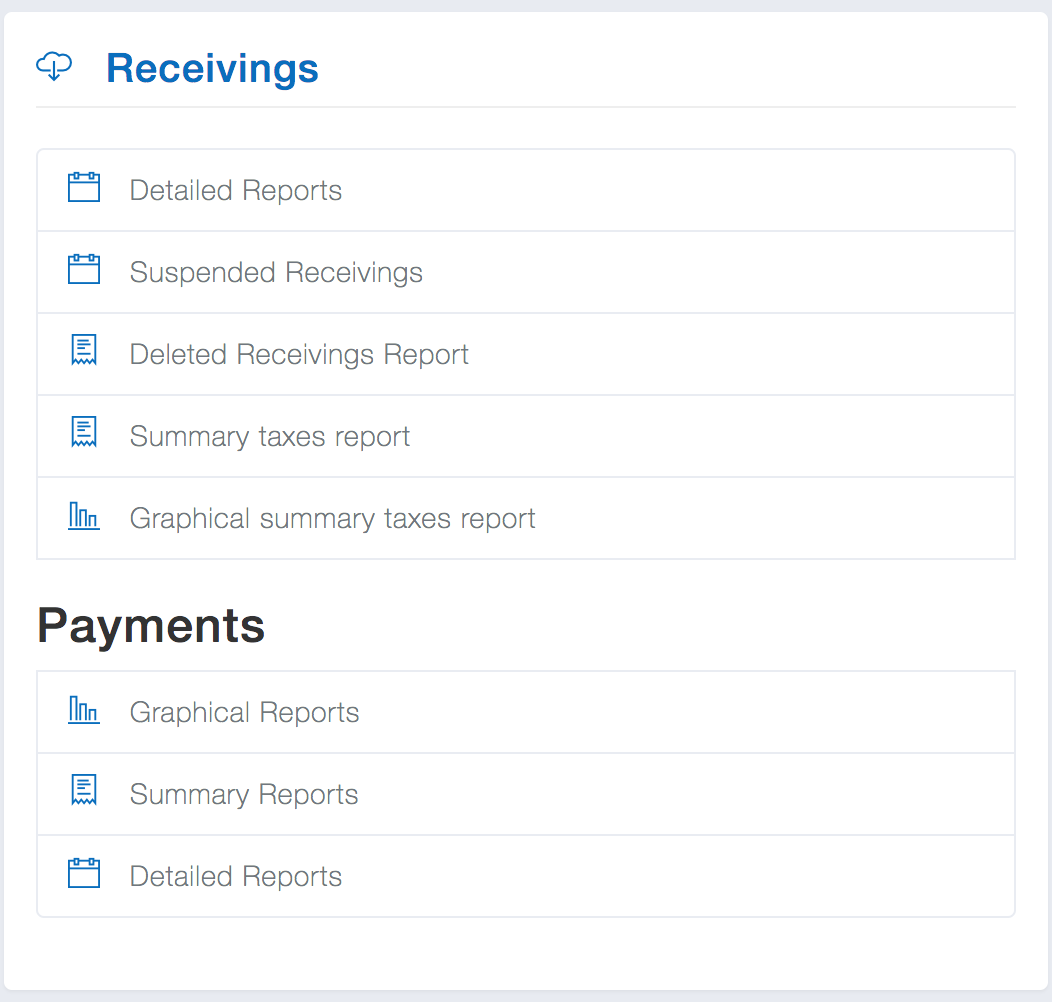
This report allows you to see information related to inventory receivings.
Below are all the types of Receivings reports:
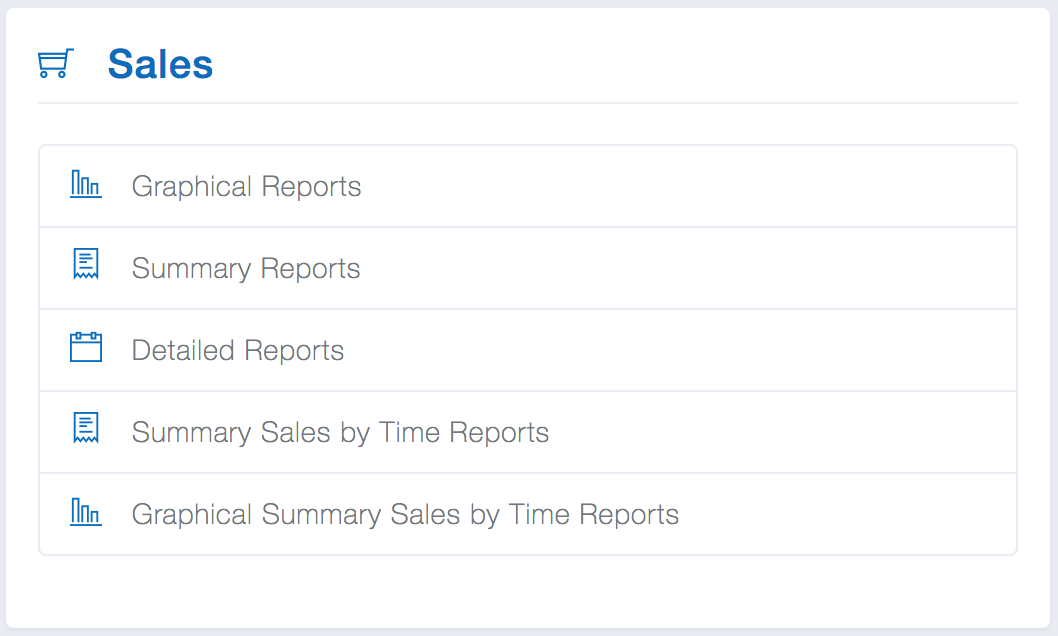
These reports allow you to see sales, and sales by time range which breaks down sales by hours of a day.
These reports allow you to see Store account activity for both Supplier Store Accounts and Customer Store Accounts as well as print statements.
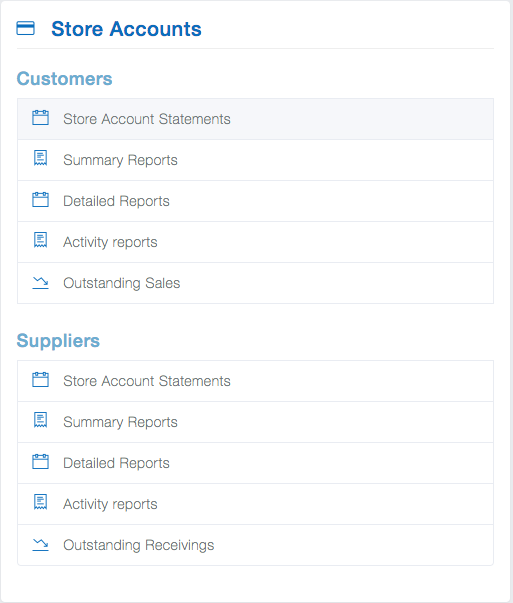
See Customer Store Accounts
and Supplier Store Accounts
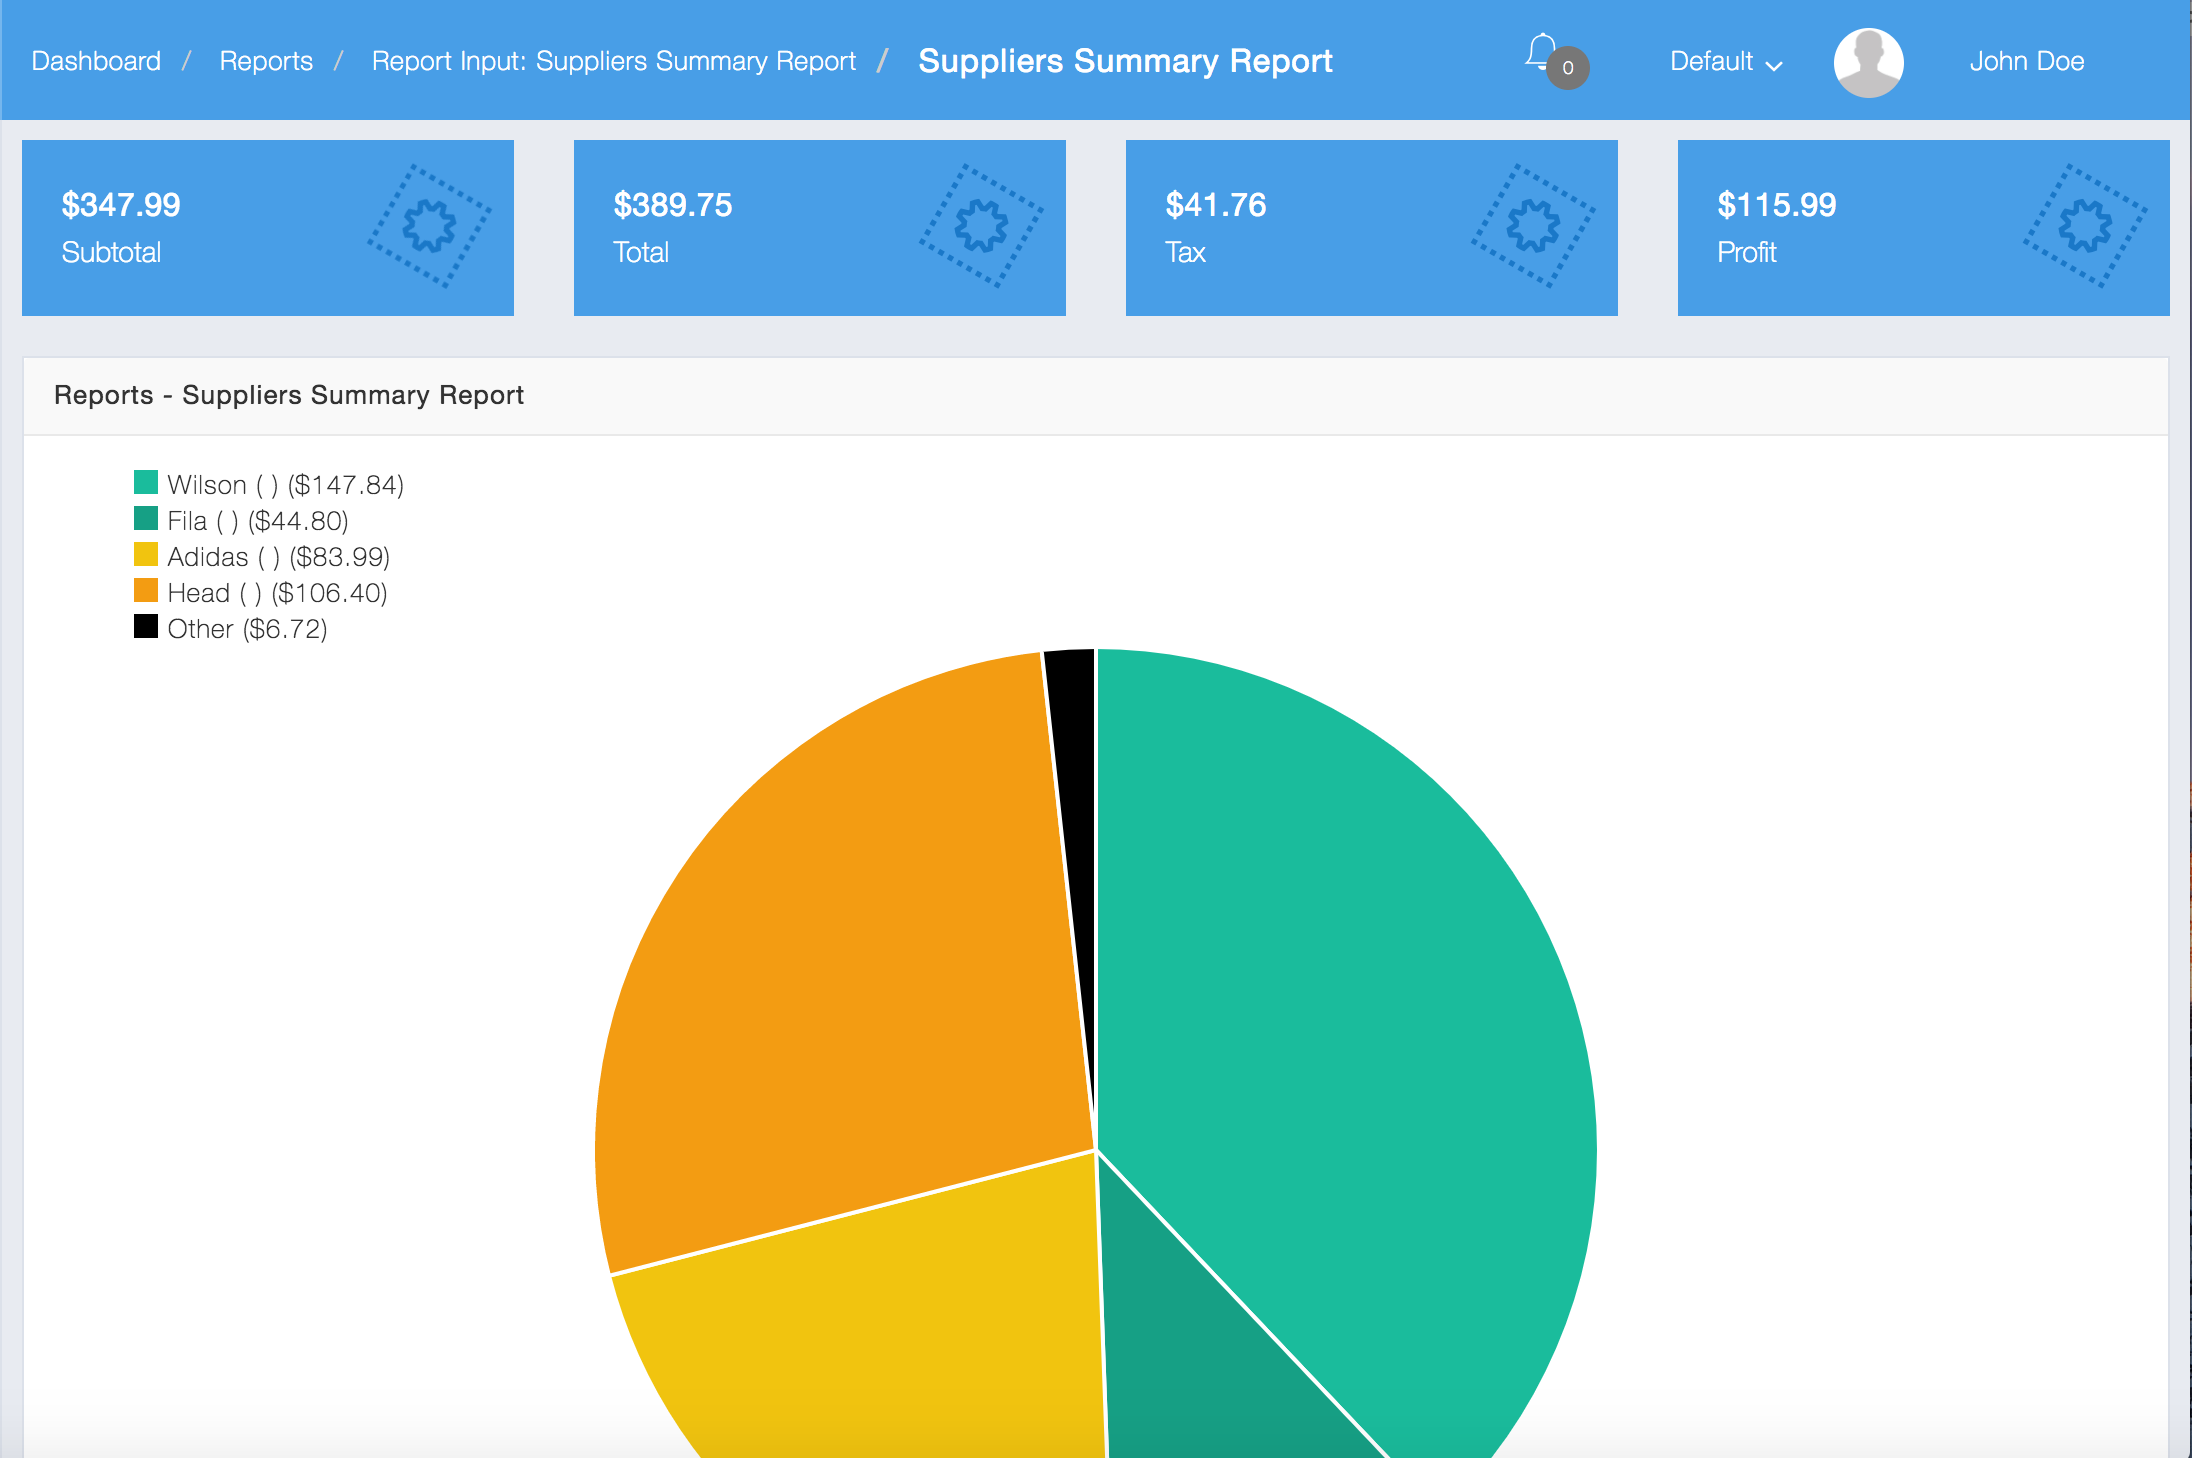
These reports allow you to see sales volumes broke down the suppliers
Below is an example of a Graphical Suppliers Report:
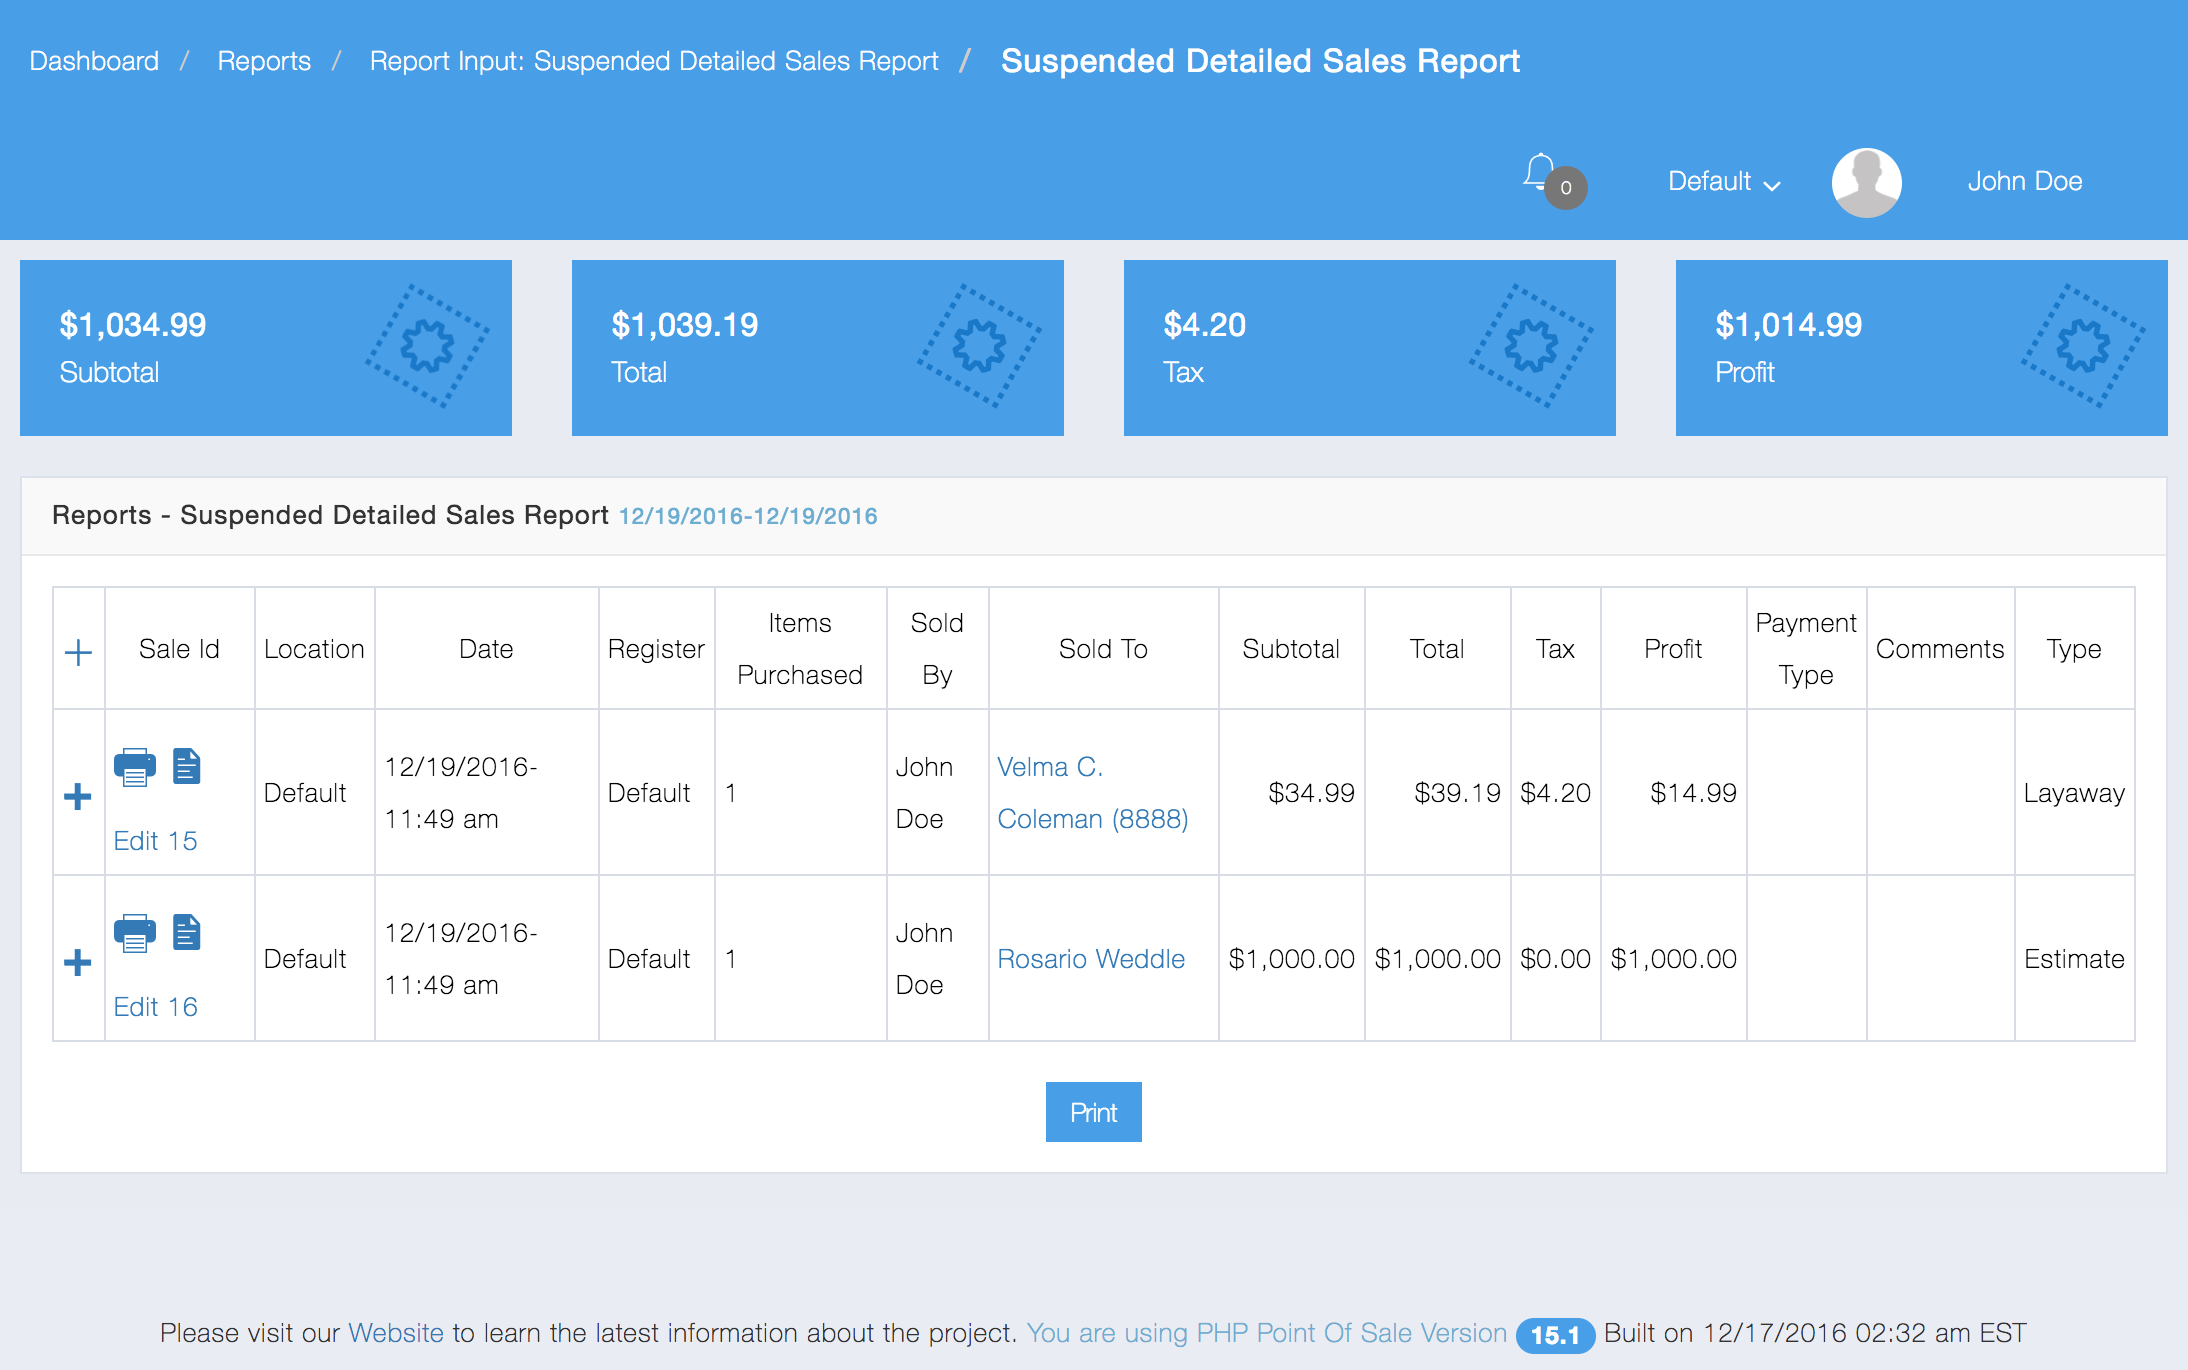
There is one report for Suspended Sales. It is Detailed Report. Below is an example:
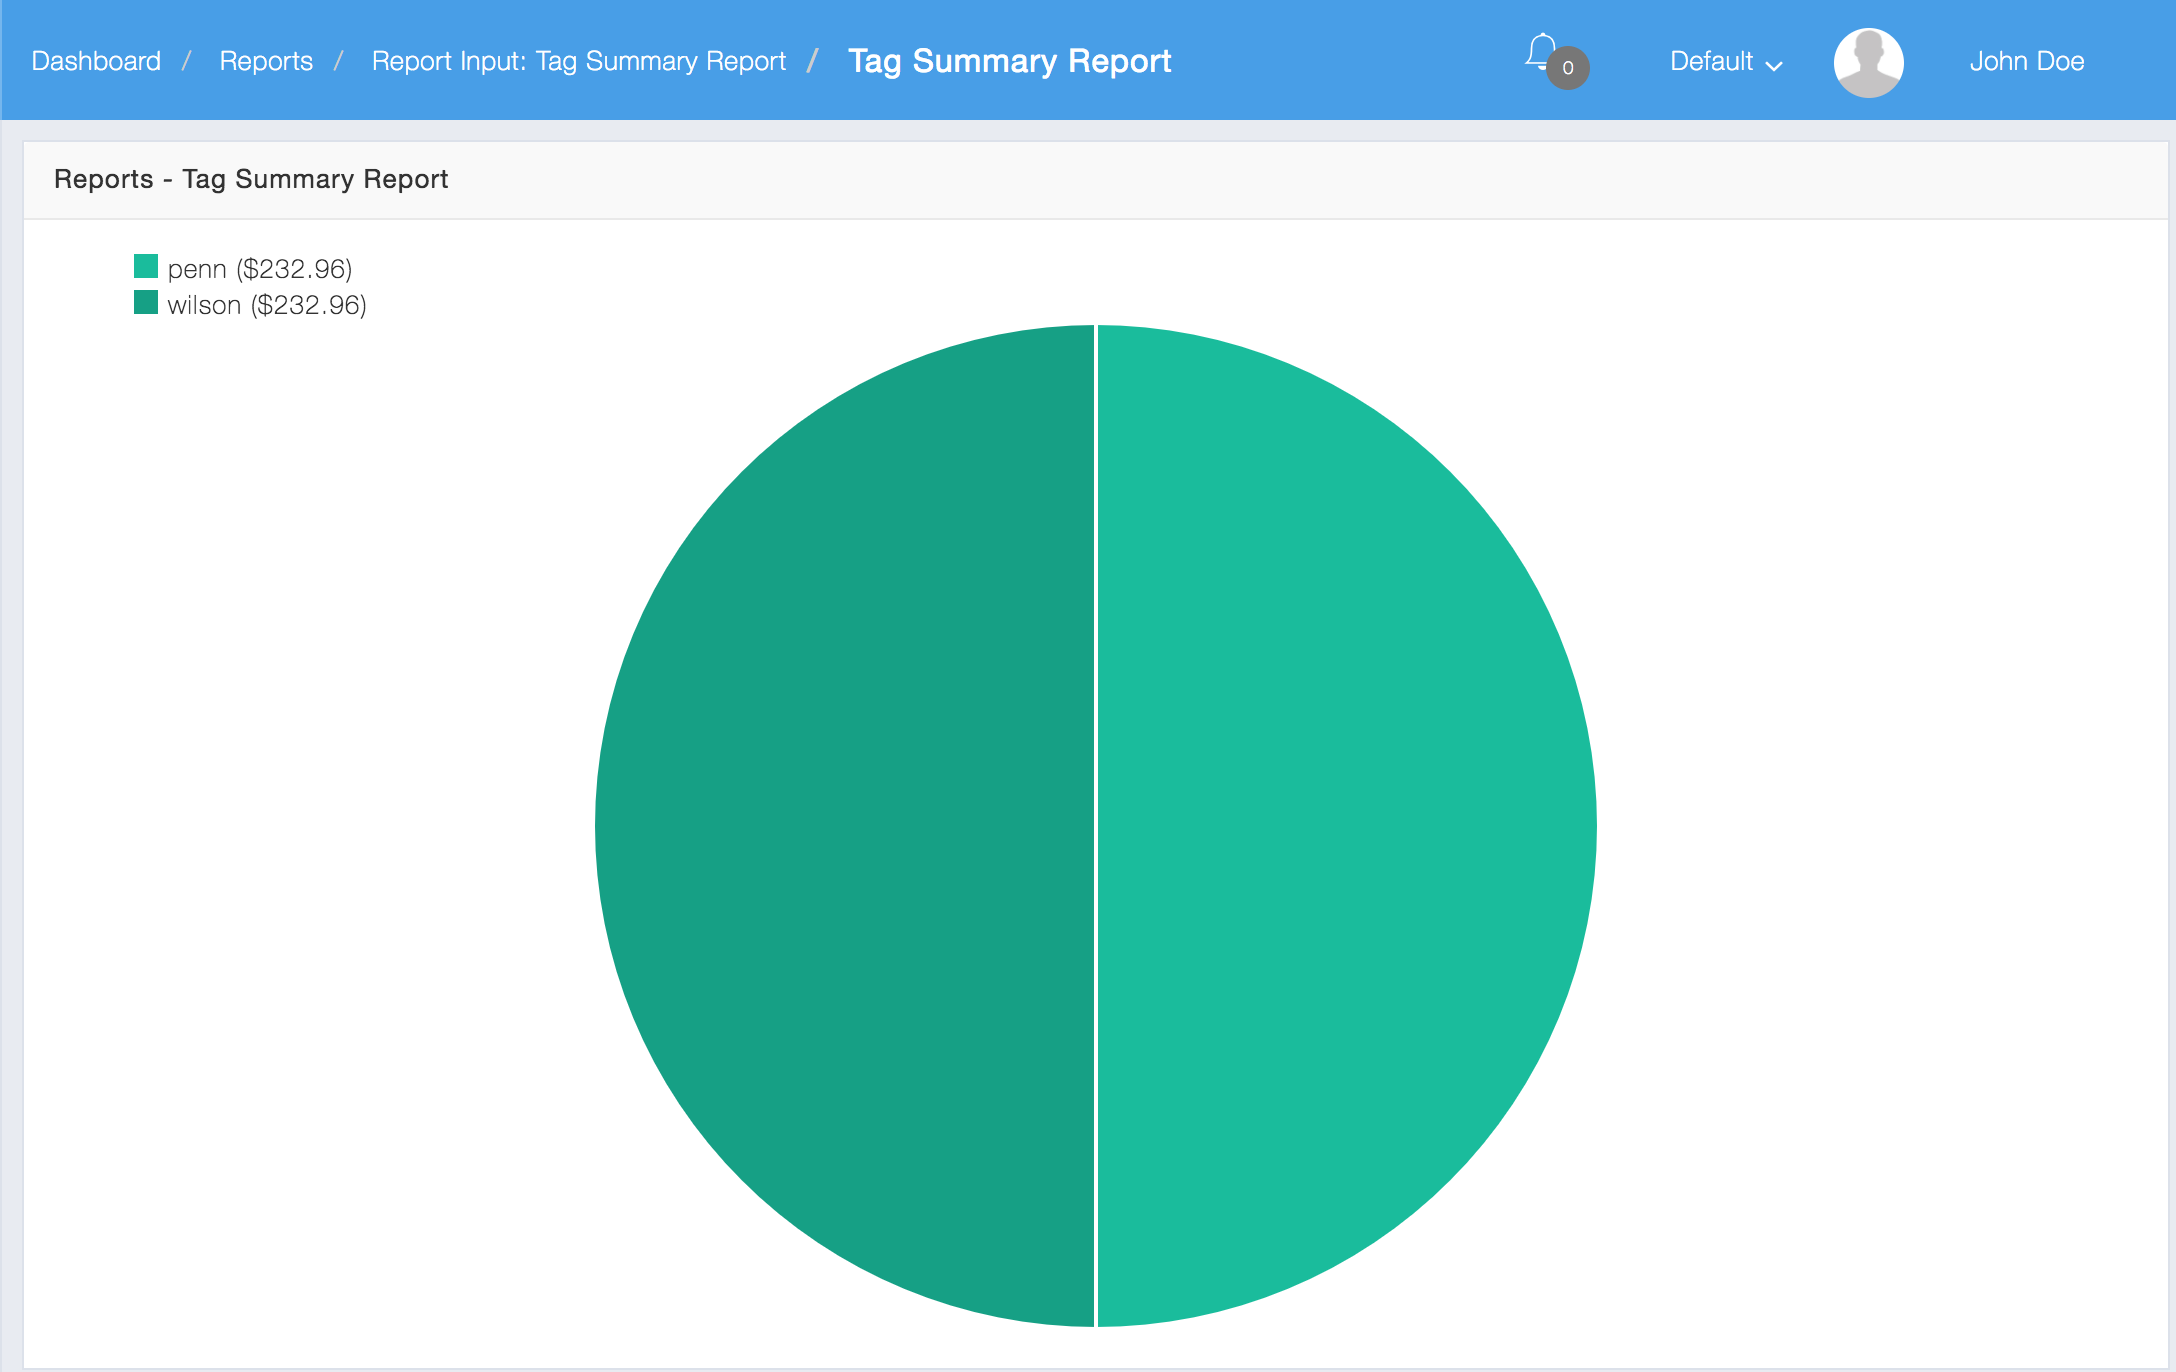
You can break sales down by tags as well.
Below is an example of a Graphical Tags Report:
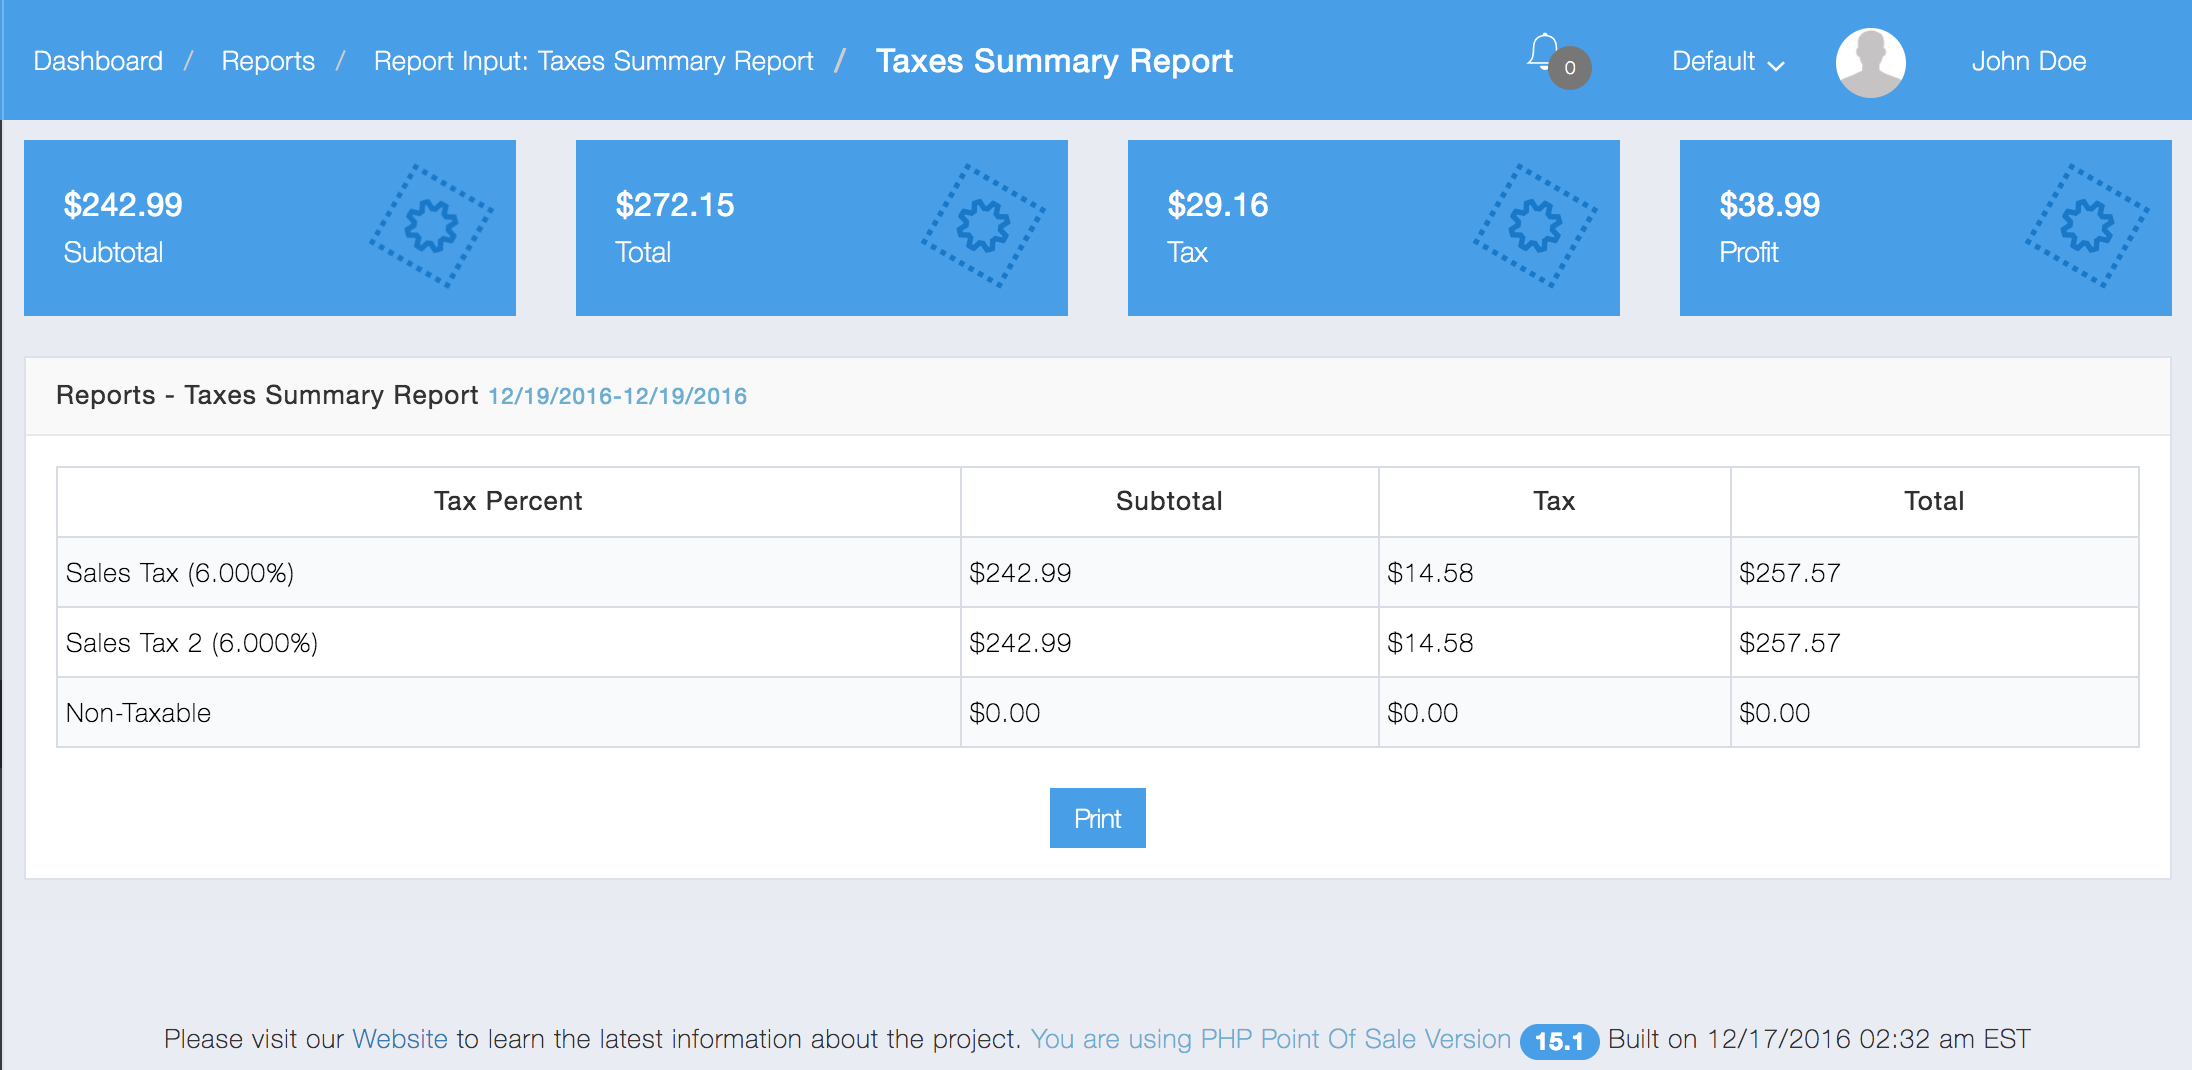
There are two report types for Taxes, Graphical and Summary. Below is an example of a Taxes Summary Report:

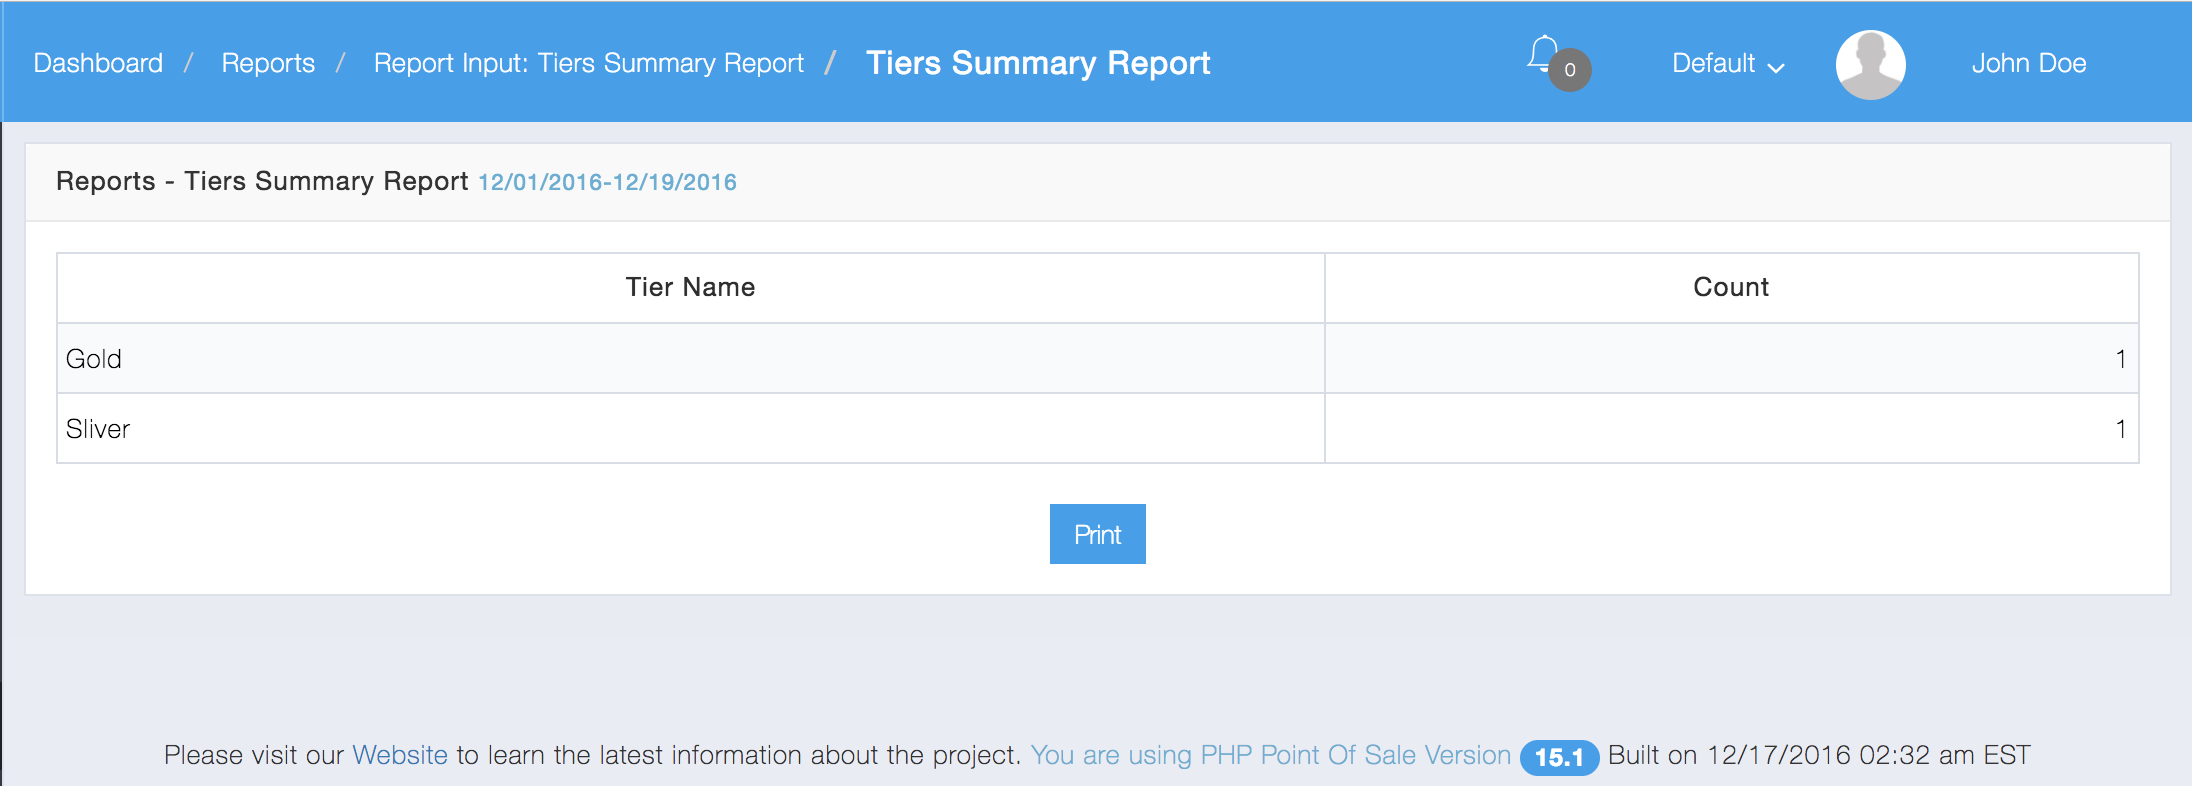
You can also view number of sales by tiers.
Below Is the Tiers Summary Report:

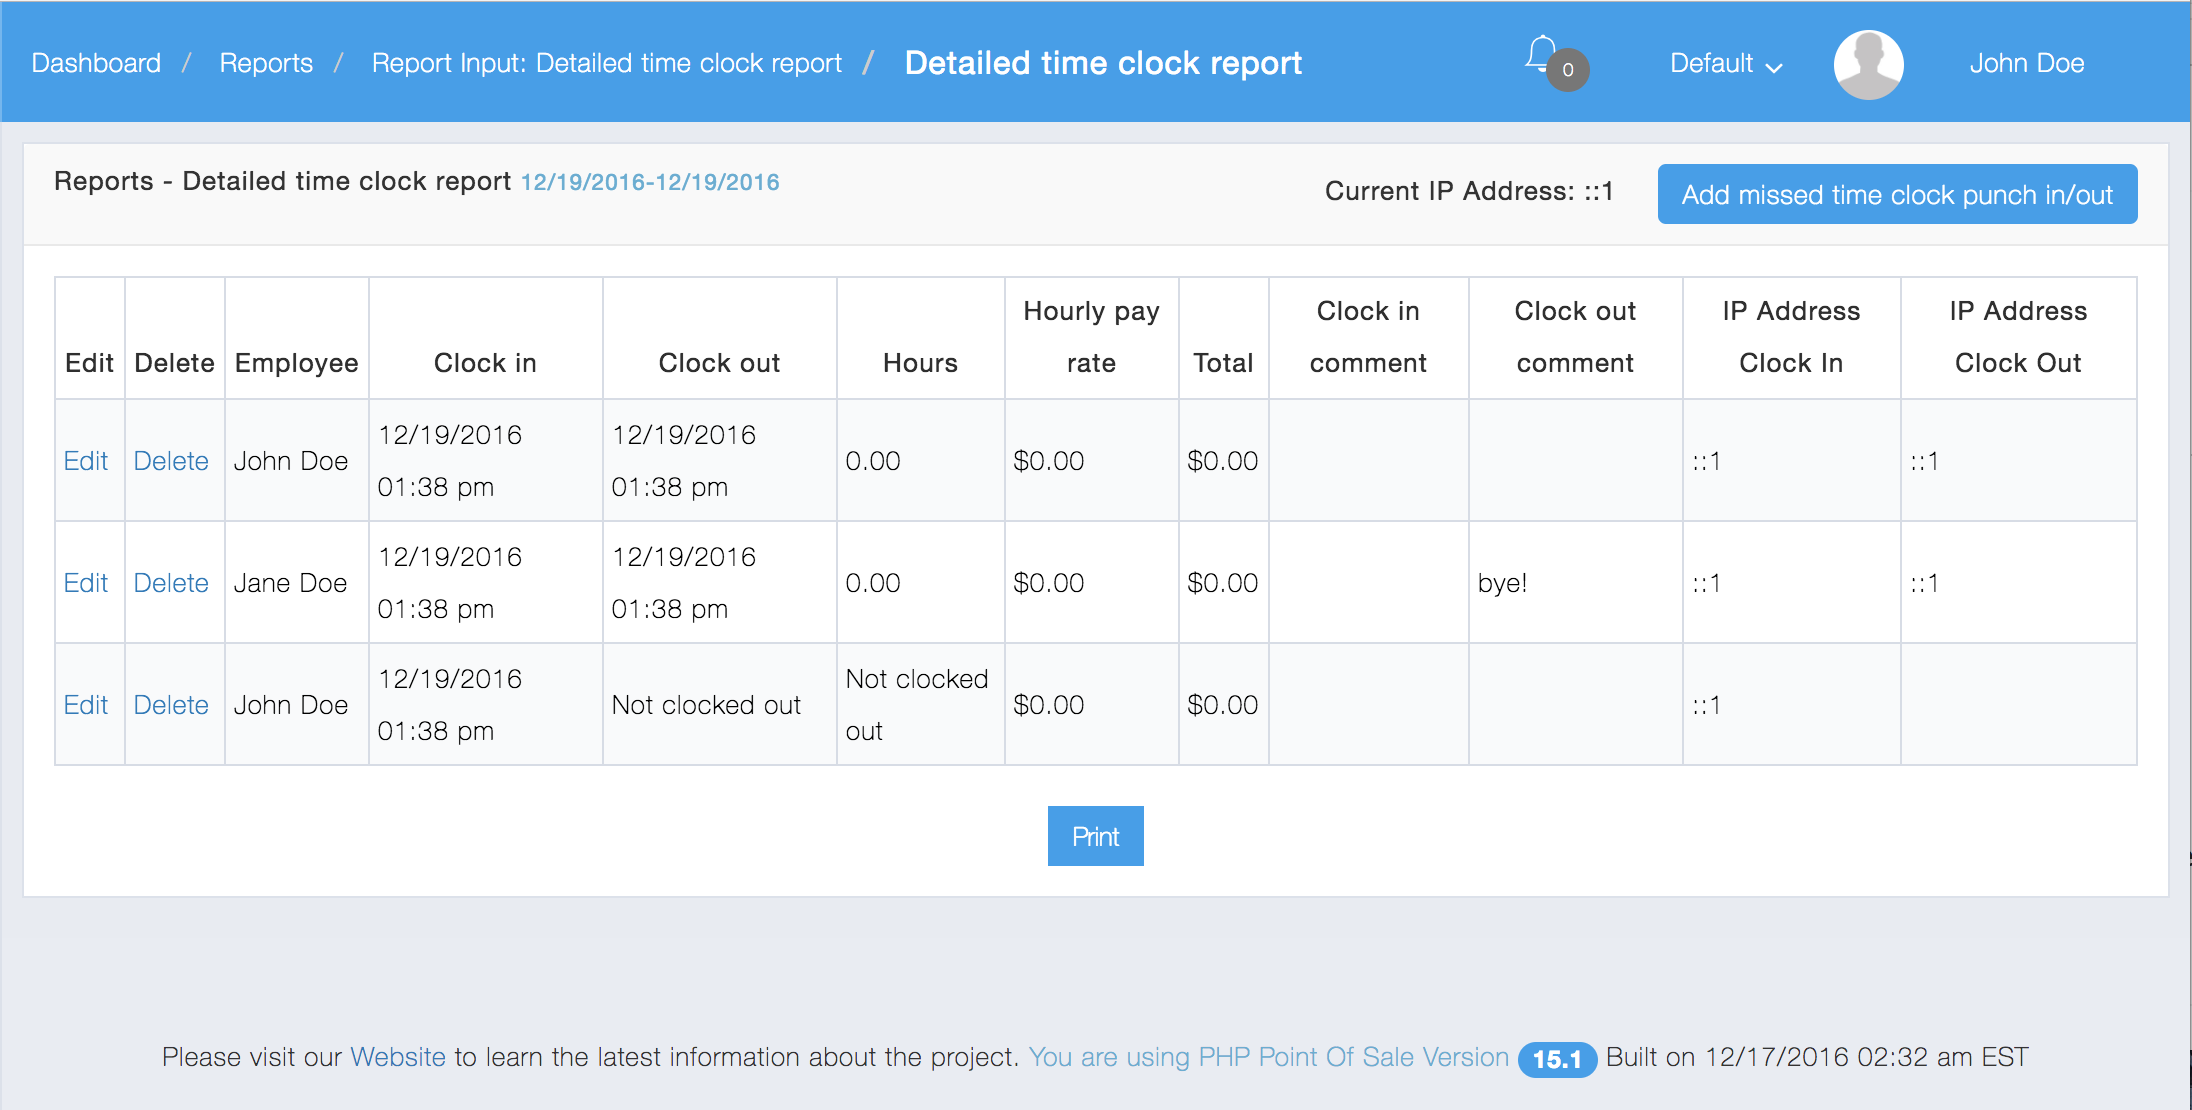
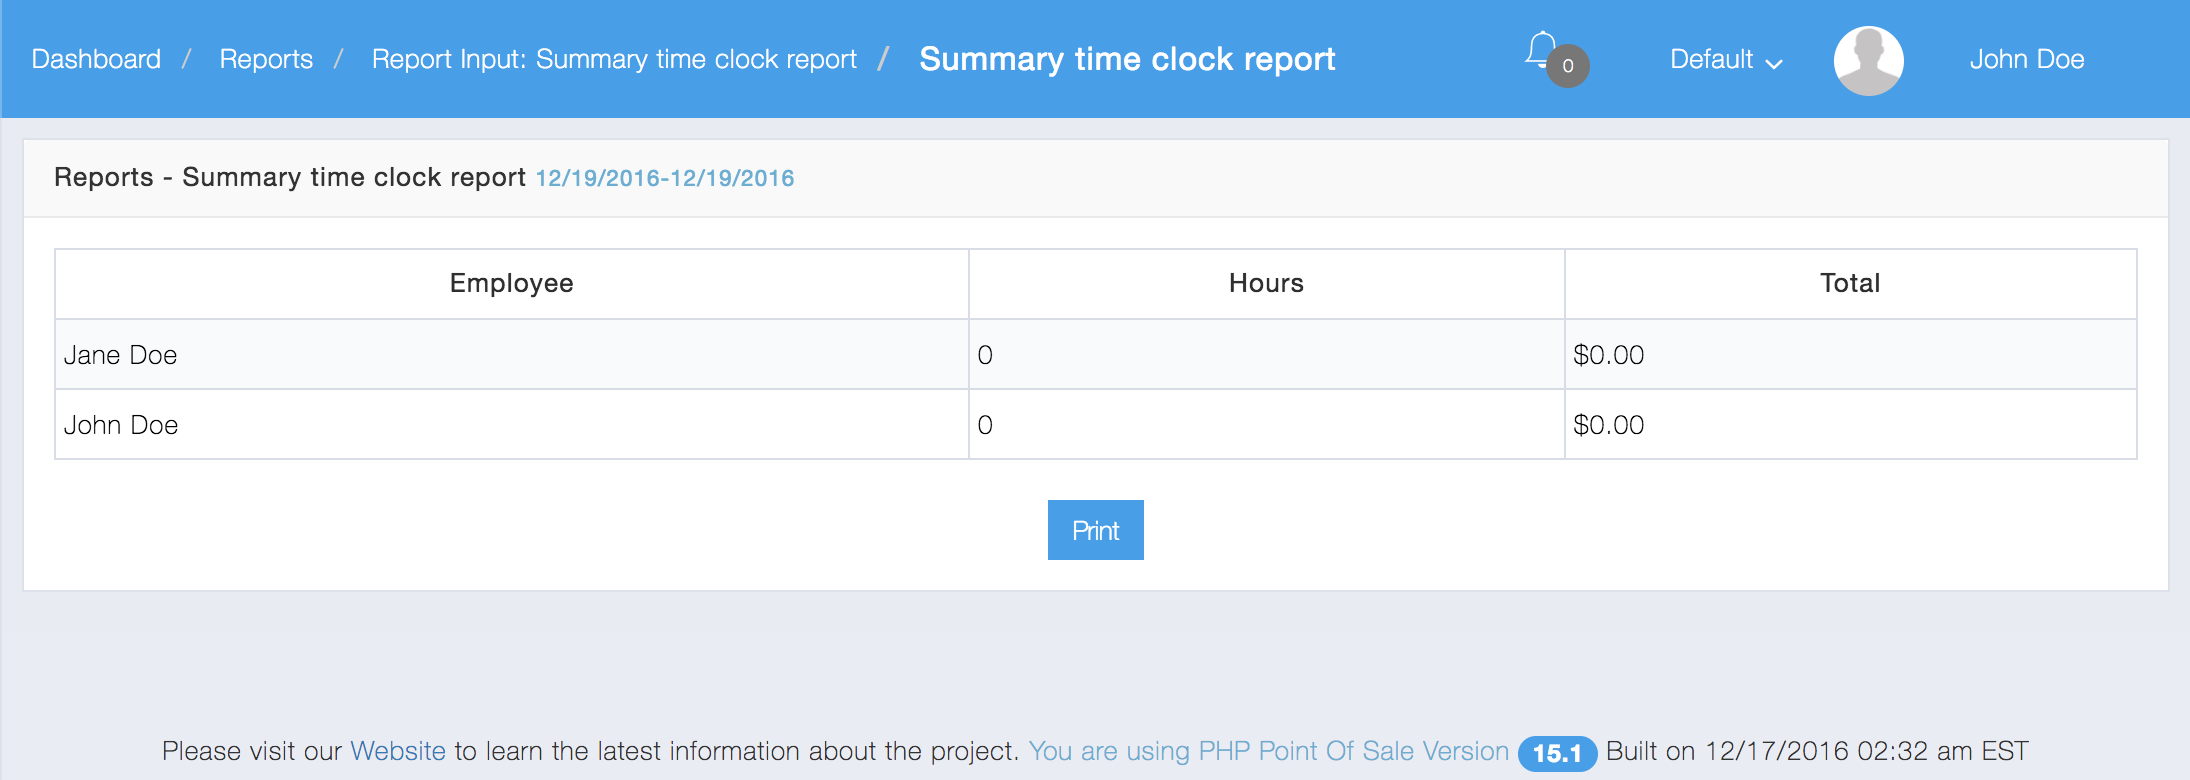
If you have Time Clock enabled in the store config settings.
Below is a Time Clock Summary Report:
There is also a more detailed Detailed Time Clock Report which allows you to edit or delete time clock records shown below:
